Contents:
-
Beyond the Buzzword: The Strategic Value of a Diverse Workplace
-
Understanding the Different Dimensions of Workforce Diversity
-
How Diversity Fuels Innovation and Market Growth
-
The Financial ROI of an Inclusive Workplace
-
Benchmarking Diversity in Tech and Creative Industries
-
A Strategic Framework for Building an Inclusive Workforce
-
Making Diversity a Data-Driven Business Imperative with Horsefly Analytics
-
Frequently Asked Questions
Key Takeaways:
1. The financial case is correlation, so build your own from workforce costs. McKinsey, BCG, and Deloitte findings show an association between diversity and performance, not proof that diversity alone drives growth. Leadership, strategy, and market conditions also matter. For your own ROI, start with turnover, which is the easiest to measure. In the piece’s hypothetical, cutting attrition in a 120-person group from 18% to 12% saves about $540,000 a year at half-salary replacement cost, but only if the drop can be attributed to the initiatives. Revenue links take more careful analysis.
2. Benchmark against the available talent pool, not national averages. A data science team in Bangalore and a design studio in London draw from very different labor markets, so a single average can set unrealistic targets or hide progress. Prioritize two or three diversity dimensions tied to real business problems, and bear in mind that measuring them varies by country: US EEO-1 ethnicity categories have no direct equivalent in France, where collecting that data is heavily restricted.
3. Track the full lifecycle, and segment to find the real problem. If underrepresented candidates are 35% of applicants but 12% of offers, you know where to look. Aggregate retention can hide mid-career attrition spikes, often around the move into people management. Report both unadjusted pay gaps (which reflect representation) and adjusted ones (which point to possible discrimination), and be clear which you’re quoting. Set minimum group sizes to protect anonymity, and watch trends for at least four quarters before drawing conclusions.
—-----------------------------------------
Beyond the Buzzword: The Strategic Value of a Diverse Workplace
A diverse workforce can do more than improve representation. It can help organizations understand different markets, broaden their access to talent, and bring new perspectives to business decisions. But demonstrating that value requires more than reporting diversity percentages.
For business leaders, the challenge is connecting workforce diversity to measurable outcomes such as employee retention, recruitment costs, innovation and market growth. That means looking beyond internal headcount data to understand the talent available in different markets and how organizations can attract and retain it.
This guide explores the business case for a diverse workforce, including the research behind its financial benefits, industry benchmarks and practical ways to measure progress. It also examines how organizations can use labor market intelligence to set realistic diversity goals and build a more inclusive workforce.
Understanding the Different Dimensions of Workforce Diversity
Workforce diversity extends beyond demographic representation. It also includes differences in employees' skills, experiences, backgrounds, and circumstances. Understanding these dimensions helps organizations decide what to measure, identify gaps in their workforce, and develop more targeted strategies. They generally fall into three categories.
Demographic Diversity
This includes characteristics such as race, ethnicity, gender, age, sexual orientation, disability, and nationality. These are among the most commonly tracked dimensions in workforce reporting, but measuring them consistently across countries can be challenging.
For example, the ethnicity categories used in the US EEO-1 framework have no direct equivalent in France, where collecting ethnic data is heavily restricted, or in Singapore, where different categories apply. Global organizations therefore need reporting approaches that account for local laws while supporting meaningful comparisons across regions.
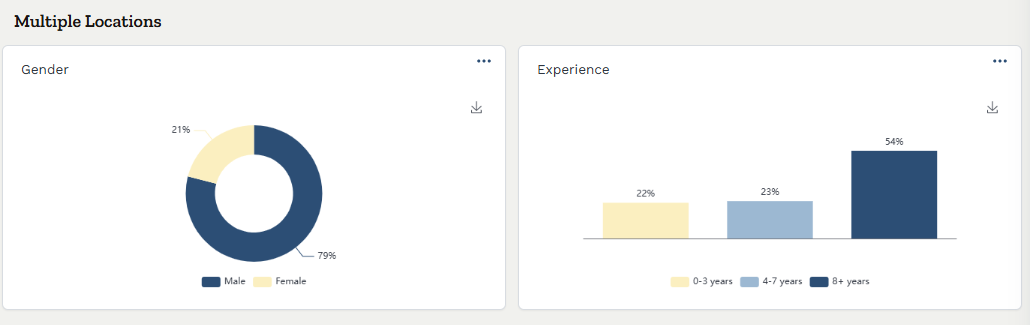
An example of DEI data from Horsefly
Cognitive and Experiential Diversity
This covers differences in educational background, skills, industry experience, functional expertise and problem-solving approaches. For example, a product team made up entirely of engineers from similar educational and professional backgrounds may share the same assumptions and overlook alternative perspectives, regardless of its demographic composition.
These differences can influence how teams approach challenges, evaluate ideas, and develop solutions. However, cognitive and experiential diversity is often harder to measure because it does not fit neatly into traditional HR systems.
Structural and Situational Diversity
This includes differences in geography, socioeconomic background, caregiving responsibilities, career paths, and working arrangements. It also considers people whose circumstances or career journeys may affect their access to employment opportunities, such as career returners and candidates from non-traditional backgrounds.
Socioeconomic background, for example, is receiving greater attention in the UK, where some employers track parental occupation as an indicator of social background.
Which Dimensions Should You Prioritize?
Although these categories provide a useful starting point, organizations don't need to measure every dimension at once. Focus on the two or three most relevant to your workforce challenges and business objectives.
For example, an organization expanding into Southeast Asian markets may prioritize nationality, language skills, and local market experience to understand whether its workforce can support that expansion. The aim is to measure the dimensions that inform better workforce decisions, rather than collect data simply for the sake of reporting.
How Diversity Fuels Innovation and Market Growth
A mix of backgrounds, experiences, and perspectives can help organizations challenge assumptions, identify opportunities, and better understand different markets. Research has found links between workforce diversity, stronger decision-making and commercial growth.
Diverse Perspectives Improve Decision-Making
Teams with varied experiences may be more likely to spot assumptions or gaps that others overlook. For example, employees familiar with different markets could identify cultural or language barriers in a product launch before they become costly mistakes.
A 2006 study by psychologist Samuel Sommers, published in the Journal of Personality and Social Psychology, found that racially diverse mock juries discussed a wider range of information. White participants in diverse groups also considered more case facts and made fewer errors than those in all-white groups. While this was not a workplace study, it illustrates how group diversity can influence decision-making.
Diversity Is Linked to Innovation and Market Growth
Business research has also identified a relationship between diversity and commercial performance:
-
Center for Talent Innovation (2013): Companies combining inherent diversity, such as gender and ethnicity, with acquired diversity, such as cultural knowledge and experience, were 45% more likely to report market share growth and 70% more likely to capture a new market.
-
Boston Consulting Group (2018): Across 1,681 companies, those with above-average management-team diversity generated 45% of revenue from products and services launched in the previous three years, compared with 26% at companies with below-average diversity.
These findings show an association, not proof that diversity alone drives growth. Leadership, strategy, and market conditions also influence business performance. Diversity is most valuable when supported by an inclusive culture where employees can contribute and challenge ideas.
Diversity Also Matters to Talent Attraction
A diverse workforce can influence how candidates perceive an employer. Glassdoor's 2020 survey found that 76% of US job seekers and employees considered workforce diversity an important factor when evaluating companies and job offers.
This makes diversity relevant to recruitment, particularly when organizations compete for specialized skills. However, attracting and retaining talent also depends on factors such as pay, career development and workplace culture. Employers should therefore track recruitment, progression and retention alongside representation to understand whether their approach is delivering meaningful results.
The Financial ROI of an Inclusive Workplace
Research suggests that diverse and inclusive organizations can achieve stronger financial outcomes, although the findings show correlation rather than proof of causation.
-
Profitability: McKinsey's Diversity Matters Even More (2023), based on 1,265 companies across 23 countries, found that companies in the top quartile for executive gender and ethnic diversity were each 39% more likely to financially outperform those in the bottom quartile.
-
Business performance: Deloitte research found that organizations with inclusive cultures were twice as likely to meet or exceed financial targets, six times more likely to be innovative and agile, and eight times more likely to achieve better business outcomes.
-
Cash flow: A 2015 Bersin by Deloitte study found that organizations with more mature talent-management practices had 2.3 times higher cash flow per employee over a three-year period. This finding relates to broader talent-management maturity, rather than inclusion alone.
These findings provide context, but they won't establish the financial return of an individual initiative. To do that, organizations need to measure the impact against their own costs and business outcomes. Three areas offer a practical starting point.
Reduced Employee Turnover Costs
Gallup estimates that replacing an employee can cost between 0.5 and two times their annual salary. If an organization can reduce avoidable turnover through better inclusion and employee support, the potential savings can be significant.
For example, consider a business with 400 engineers earning an average of $150,000 annually. If attrition among a 120-person employee group falls from 18% to 12%, that represents approximately seven fewer departures each year. At a conservative replacement cost of half the average salary, the estimated saving is around $540,000 annually.
This is a hypothetical calculation, not a guaranteed return. Actual savings depend on replacement costs and whether the reduction in turnover can be attributed to the initiatives.
Recruitment Costs and Time-to-Fill
A broader sourcing strategy can help organizations reach candidates beyond familiar recruitment channels. Track whether these efforts improve qualified candidate numbers, reduce agency reliance, or shorten time-to-fill for difficult roles.
External labor market data can help identify where relevant skills are available, which markets offer access to a wider talent pool, and what competitors are paying.
Access to New Markets and Revenue
Diverse teams may also help organizations understand and serve different customer groups. However, attributing revenue growth directly to workforce diversity is difficult.
Organizations can start by tracking performance in new markets or customer segments alongside the skills, market knowledge, and experience represented in the teams responsible for those opportunities. This can reveal useful patterns without assuming diversity alone drove the results.
Employee retention is often the most straightforward place to start measuring financial impact. Revenue growth may offer a compelling longer-term case, but it requires more careful analysis to establish a credible link. Start with measurable workforce costs and build from there.
Benchmarking Diversity in Tech and Creative Industries
Industry benchmarks help organizations identify representation gaps and understand how their workforce compares with the available talent pool.
Technology
The US technology sector faces gaps in both gender and racial representation. According to NCWIT, women held just 27% of professional computing roles in 2023. Pew Research Center's 2021 analysis also found that Black workers made up 9% of the US STEM workforce and Hispanic workers 8%, both below their representation in the wider workforce.
However, improving representation is only part of the challenge. The Kapor Center's Tech Leavers Study identified unfair treatment as a leading reason employees leave technology jobs. It estimated that unfairness-related turnover costs the US tech industry $16 billion annually.
Creative Industries
Socioeconomic background remains a significant representation gap in the UK creative sector. The Creative Industries Policy and Evidence Centre found that just 16% of creative workers came from working-class backgrounds, compared with almost a third of the wider workforce.
Gender representation also remains uneven. USC's Annenberg Inclusion Initiative found that women directed just 13.4% of the 100 top-grossing films in 2024.
Using Benchmarks Effectively
National averages provide context, not targets. Organizations should compare representation with the available talent pool for each role and location. A data science team in Bangalore and a design studio in London, for example, draw from very different labor markets.
Horsefly's labor market intelligence helps organizations understand local talent availability, assess workforce demographics, and set more realistic diversity targets.

A Strategic Framework for Building an Inclusive Workforce
Building an inclusive workforce requires action across three areas: hiring, retention and workforce planning.
1. Make Hiring More Inclusive
Use structured interviews with consistent questions and scoring criteria to make candidate assessments fairer and reduce the influence of individual bias.
Blind resume screening can help reduce bias at the initial selection stage, but it should be combined with other measures. Diverse interview panels can also bring different perspectives to candidate assessments and help applicants see a broader range of representation within the organization.
2. Strengthen Culture and Retention
Inclusion needs visible leadership support, backed by resources and regular reviews of workforce data.
Mentorship helps employees develop, while sponsorship goes further by actively advocating for career progression and opportunities. Employee resource groups can also provide valuable support and insight, but they need proper funding and recognition rather than relying solely on unpaid employee contributions.
3. Use Data to Guide Workforce Planning
Combine internal workforce data with external labor market intelligence to identify representation gaps, understand where relevant talent is available, and assess competition for skills.
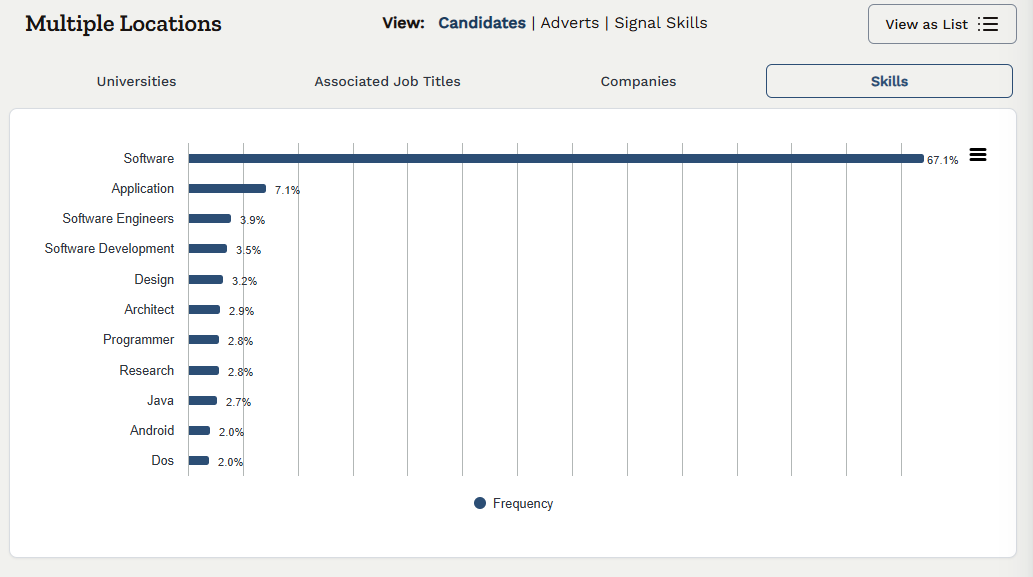
Skills data from the Horsefly platform
This helps organizations set realistic diversity goals, target broader talent pools and make better-informed recruitment decisions.
From Initiative to Impact: Measuring DEI Success with KPIs
Measuring diversity well requires tracking the full employee lifecycle, not just headcount snapshots. These are the KPIs we recommend, grouped by what they reveal.
Representation
-
Diverse candidate share at each funnel stage (sourced, screened, interviewed, offered, hired)
-
Representation by level, especially leadership and the level immediately below
-
Representation against available labor market supply for each role and location
Funnel stage conversion is the most diagnostic metric here. If underrepresented candidates make up 35% of applicants but 12% of offers, you know precisely where to look.
Retention
-
Voluntary turnover by demographic group, segmented by tenure band
-
Regretted attrition rates by group
-
First-year attrition for diverse hires
Aggregate retention rates hide problems. Segmenting by tenure often shows early-career retention looks fine while mid-career attrition among women or ethnic minorities spikes, frequently around the transition to people management.
Inclusion and Advancement
-
Promotion rates by demographic group, normalized for eligible population
-
Time-to-promotion by group
-
Pay equity, measured as adjusted pay gaps controlling for role, level, location, and tenure
-
Inclusion scores from engagement surveys, broken out by group
Pay equity analysis deserves particular care. Unadjusted gaps reflect representation problems; adjusted gaps reflect potential discrimination. You need both numbers, and you need to know which one you are reporting. With pay transparency legislation expanding across the EU and US states, reliable compensation benchmarks are now a compliance requirement as well as a fairness measure.
Making the Data Work
Three practical points from our experience. First, set minimum group sizes for reporting to protect anonymity; small cohorts produce noisy and potentially identifying results. Second, report trends over at least four quarters before drawing conclusions. Third, connect workforce analytics to business data. Promotion rate gaps become a leadership priority faster when you can show their correlation with team performance or customer retention.
Making Diversity a Data-Driven Business Imperative with Horsefly Analytics
Setting meaningful diversity goals requires more than understanding your current workforce. Organizations also need to know where relevant talent is available, what skills it brings, and how competitive each hiring market is.
Internal HR data shows who you employ. External labor market intelligence adds the market context: talent availability, location, skills supply, salary expectations, and competitor hiring activity. Combining these insights helps organizations set realistic diversity targets, identify broader talent pools and make more informed workforce planning decisions.
Horsefly Analytics helps organizations turn labor market data into actionable workforce insights. Whether you're reviewing representation gaps, exploring new talent markets or planning future hiring needs, Horsefly gives your team the external intelligence to make better-informed decisions.
Ready to take a more data-driven approach to workforce diversity? Book a strategic consultation and see how labor market intelligence can support your workforce planning strategy.

Frequently Asked Questions
How does a diverse workforce lead to better financial results?
A diverse workforce significantly boosts financial performance, with companies in the top quartile for diversity often outperforming competitors. This advantage stems from increased profitability, enhanced business outcomes, and higher cash flow per employee. Diverse teams also foster greater innovation and market share growth.
What specific types of diversity should organizations focus on tracking?
Organizations should track demographic (race, gender), cognitive (skills, experience), and structural (geography, socioeconomic background) diversity. Prioritize two or three dimensions that directly align with current business problems or strategic goals, rather than attempting to track every category simultaneously.
How can companies accurately measure the financial ROI of their diversity and inclusion programs?
Companies can measure ROI by calculating savings from reduced employee turnover, lower recruitment costs due to broader talent pools, and increased revenue from new market access. Reduced turnover cost is often the easiest component to quantify initially, building credibility for other benefits.
What are the most effective strategies for inclusive hiring practices?
Effective inclusive hiring relies on structured interviews, where all candidates for a role answer the same questions scored by a rubric, to reduce bias. Incorporate blind resume screening for initial stages and ensure interview panels themselves are diverse to improve assessment quality and candidate experience.
Why is comparing a company's diversity metrics against national averages often misleading?
Comparing against national averages is misleading because the relevant benchmark is the available talent pool for each specific role and location where a company hires. Different labor markets have unique demographic compositions, so a single global average can lead to unrealistic targets or understated progress.
What is the critical difference between mentorship and sponsorship for career development?
A mentor provides guidance and advice, offering insights and support. A sponsor, conversely, actively uses their political capital and influence to advocate for an individual, recommending them for stretch assignments or promotions, directly impacting career progression within the organization.
How can companies ensure diverse teams are truly inclusive and avoid internal conflict?
Ensuring inclusivity requires visible leadership commitment reflected in budgets and metrics, not just statements. Implement strong sponsorship programs to elevate underrepresented talent, and properly compensate or resource employee resource groups (ERGs) to value their contributions to company strategy and culture.
Sources: Horsefly Analytics, Glassdoor, Deloitte, Gallup, USC's Annenberg Inclusion Initiative, Josh Bersin, McKinsey, Pew Research Center, Kapor Center