Contents:
Key Takeaways:
1. Use the right source for the decision, because each was built to answer a different question. Government data gives a defensible public baseline but uses broad occupation codes and excludes bonuses and equity. Employer-reported surveys suit structured job pricing. Staffing guides show what it takes to close candidates now. Posting data is freshest but shows offers, not actual pay. A useful rule: posting data tells you what the market is doing, survey data tells you what employers actually pay, and strategic decisions usually need both.
2. Read the spread and the sample size, not just the median. A narrow 25th-to-75th percentile gap suggests a commoditized role, while a wide one means the title covers different jobs or skill premiums are large, so tighten your job matching before trusting the benchmark. Set band minimums and maximums from observed percentile spreads rather than a fixed plus or minus 20%, and ask for the count behind each cut, since a 75th percentile built on 14 data points is only directional.
3. Test your bands against hiring outcomes and keep crowd-sourced data in its lane. A band that looks competitive on paper but produces repeated declines is wrong, so compare it with offer acceptance, time-to-fill, and regretted attrition. Demand indicators such as posting volume, posting duration, and the ratio of postings to available talent often signal pay pressure before annual benchmarks do. Self-reported data is fine for spot-checks and understanding candidate expectations, but its selection bias, weak validation, and inconsistent job matching make it a poor basis for pricing a job family.
—------------------------------------------
Why Accurate Salary Data is a Strategic Imperative
Most enterprises don't get compensation wrong because they lack data, but because they use the wrong data for the decision in front of them, such as a government median for a niche AI position or a crowd-sourced figure for a site selection model. This article explains where salary market data comes from, how each source is built, what moves a compensation range, and how to turn those inputs into decisions that hold up in front of a CFO.
Set an offer range 10% below market for a scarce skill, and you pay for it later in extended vacancies, agency fees, and declined offers. Set it 10% above market across a 2,000-person job family, and you have locked in a recurring cost that compounds with every merit cycle. Neither error shows up as a single dramatic failure. Both appear slowly in time-to-fill reports and budget variances.
For leaders responsible for strategic workforce planning, compensation data feeds headcount cost models, location decisions, build-versus-buy analysis, and retention risk scoring. When the underlying number is stale or poorly matched, every downstream model inherits the error.
The Environment of Salary Data Sources
Salary data sources fall into four broad categories, and each was built to answer a different question.
Government Statistics
In the US, the Bureau of Labor Statistics publishes salary data through its Occupational Employment and Wage Statistics (OEWS) program, covering roughly 800 occupations across national, state, and metropolitan geographies. Most developed economies run a comparable national statistics program. These are the most statistically rigorous public sources available, and they are free.
Commercial Survey and Compensation Providers
Firms like Salary.com aggregate employer-reported compensation data, typically sold through subscription tools that let compensation teams match internal positions to market benchmarks with filters for industry, revenue, and location.
Staffing and Recruitment Firms
Robert Half publishes an annual salary guide drawing on its placement activity and recruiter observations. This is data seen from the hiring desk, which makes it useful for understanding what it takes to close candidates right now in the functions the firm recruits for.
Crowd-sourced and job posting data. Platforms where employees self-report pay, plus aggregators that scrape advertised salary ranges from postings. Pay transparency laws in states like Colorado, California, New York, and Washington, along with the EU Pay Transparency Directive, have expanded the volume of posted salary data considerably.
No single category covers everything a global enterprise needs. The practical skill lies in knowing which one to trust for each decision.

How Salary Data is Collected: A Look Under the Hood
Methodology determines what a number can and cannot tell you. Here is how the main approaches actually work.
Government Survey Methodology
The U.S. Bureau of Labor Statistics' Occupational Employment and Wage Statistics (OEWS) program contacts approximately 186,000 to 189,000 establishments in each semiannual survey panel. It combines six panels collected over three years to produce estimates based on a sample of approximately 1.1 million establishments. Older panels are aged forward using salary adjustment factors, but the underlying sample still reaches back years. The estimates are released annually, and the reference period typically sits close to a year behind publication.
The strengths are real: a probability-based sample, mandatory or high-participation response in many cases, and consistent occupation coding through the Standard Occupational Classification system. The weaknesses matter just as much. SOC codes are broad, so a "Software Developer" figure blends a junior web developer in a regional bank with a staff engineer at a hyperscaler. OEWS wages exclude non-production bonuses and equity, and high salaries are top-coded, which distorts senior technology and finance positions where variable pay and stock make up much of total compensation.
Employer-Reported Survey Data
Commercial providers collect data directly from HR departments, usually matched to the provider's own job architecture with defined leveling criteria. Done well, this gives you base, short-term incentive, and long-term incentive broken out separately, with clean role matching. The tradeoff: participation skews toward larger, more structured employers, and survey cycles mean the data reflects pay practices from the last window. Data validation quality varies by provider, and it pays to ask how they handle outliers and mismatched submissions.
Job Posting Aggregation
Posting data is the freshest signal available. It reflects what employers are advertising this week, at the level of specific skills and cities. It also has blind spots. Posted ranges are offers, not actual pay. Some employers post deliberately wide ranges to satisfy transparency laws without revealing much. Postings over-represent roles that are hard to fill and under-represent ones filled through internal mobility or referrals.
Our view at Horsefly Analytics: posting data answers "what is the market doing now," while survey data answers "what are employers actually paying." Strategic decisions usually need both.
Key Factors That Determine Compensation Ranges
Job title, industry, location, and experience set the baseline. The errors we see most often come from how leaders interpret those variables.
Location: labor costs versus cost of living. These are often conflated, but they measure different things. Cost of living reflects what it takes for an employee to live somewhere. Cost of labor reflects what employers must pay to recruit talent, shaped by local supply and competition. A city can be expensive to live in yet have moderate pay levels if its talent pool is deep. Pay structures should be based on labor costs, not living expenses. Remote and hybrid work complicate this further, as a candidate’s strongest competing offer may come from an employer in an entirely different location.
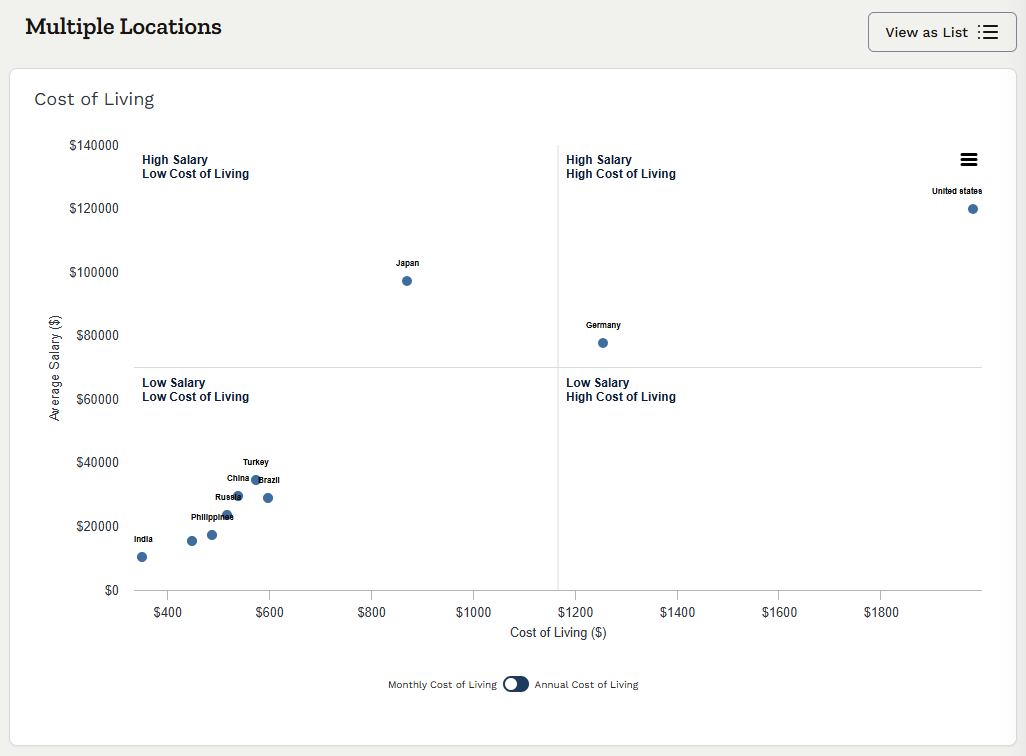
Image shows the Cost of Living functionality within Horsefly
Industry: A data engineer in financial services and a data engineer in manufacturing often perform similar work at different price points. Benchmarking against the wrong industry cut is a quiet way to overpay or lose candidates.
Company size: Larger organizations tend to pay more in base and long-term incentives, partly because positions at scale carry broader scope. Matching a position at a 50,000-person enterprise against a sample of mid-sized firms understates the competitive rate.
Skills: Two people with the same title can command very different pay depending on a single skill. A cloud security engineer with specific platform certifications, or a controls engineer with automation experience, will clear the occupational median comfortably.
Demand for the role. This is the factor least explained by most sources, so it is worth being specific about how it gets quantified. Useful demand indicators include:
-
Job posting volume, and its trend over recent quarters.
-
The ratio of active postings to the estimated available talent pool.
-
Average posting duration and repost rates, which signal positions that employers struggle to fill.
-
Movement in advertised salary ranges over time for the same role and location.
When postings rise faster than supply and posting durations stretch, salary pressure follows, usually before it appears in annual benchmarking data. That lead time is the reason demand metrics belong in any compensation review for scarce positions.
Interpreting the Data: Beyond Averages and Medians
A median tells you where the middle of the market sits. It tells you nothing about the spread, and the spread is where compensation decisions get made.
Look at the full percentile distribution:
-
25th percentile: typically maps to employees still building proficiency, or to organizations that pay lower and compensate with other elements.
-
50th percentile: the rate for a fully competent incumbent.
-
75th percentile: experienced performers, high-demand competency sets, or employers with a lead-the-market philosophy.
-
90th percentile: top performers, rare capabilities, or positions with expanded scope.
The distance between percentiles conveys information. A narrow 25th-to-75th spread suggests a commoditized role with standardized pay. A wide spread suggests the title covers very different roles, or that skill premiums are large. Wide spreads are a warning to tighten your job matching before trusting the benchmark.
When building pay bands, we recommend anchoring the midpoint to your chosen position, then setting minimums and maximums based on observed percentile spreads rather than a fixed formula like plus or minus 20%. A fixed range width applied across all job families will be too tight for some and too loose for others.
Sample size deserves scrutiny as well. A 75th percentile figure built on 14 data points for a specific role in a secondary city is an estimate with wide error. Ask your provider for the count behind each cut, and treat thin samples as directional.
A Comparative Analysis of Top Data Providers
The table below summarizes how the major source types differ. These are general characteristics; specific products within each category vary.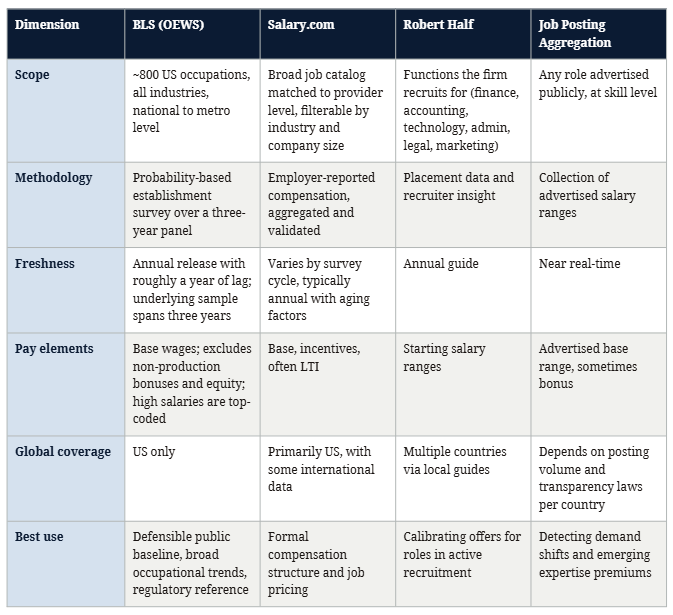
On BLS versus Salary.com specifically: BLS offers stronger statistical design and free access, but broad role definitions and lag limit its use for pricing specific roles. Salary.com offers better job matching and pay element detail, at the cost of a narrower, employer-selected sample and a subscription. Most mature compensation functions use a provider like Salary.com for pricing and reference BLS as a sanity check.
The gap none of these fully closes is consistent global coverage. For enterprises hiring across 20 or 30 countries, stitching together separate national sources with different occupation codes, pay definitions, and release cycles is slow, and the inconsistencies introduce error into every cross-country comparison.
The Hidden Risks of Free and Crowd-Sourced Data
Free data is useful for individual job seekers and as a rough check. It is risky as the basis for enterprise decisions, for reasons that compound.
-
Self-reporting bias. People who volunteer their pay are not a random sample. Recent job changers, people who feel underpaid, and employees in certain tech-heavy communities are over-represented. The resulting figures can skew high or low depending on who chose to report.
-
Weak validation. Many platforms cannot verify that a submission is real, current, or accurately titled. One mislabeled entry in a thin sample moves the number.
-
Inconsistent job matching. "Senior Analyst" at a global bank and "Senior Analyst" at a 200-person firm are different positions. Crowd-sourced platforms generally rely on whatever title the contributor typed.
-
Age of data. Submissions persist for years. Unless the platform weights or filters by date, you may be benchmarking against a pre-inflation market.
-
Thin global coverage. Self-reported data clusters in English-speaking sectors and large metros. For a manufacturing workforce in Central Europe or a shared services center in Southeast Asia, the sample may be too small to use.
The risk to strategy is specific. A location decision, a pay structure redesign, or a headcount budget built on unvalidated figures can be off by enough to change the outcome, and the error often stays hidden until hiring underperforms or attrition spikes. We have no objection to using these sources to spot-check or to understand candidate expectations, since candidates read them too. Just don't price a job family on them.
Applying Salary Intelligence to Your Compensation Strategy
Data has value only once it changes a decision. Here is the sequence we see work in practice.
1. Define your compensation philosophy explicitly. Decide where you intend to sit against the market (lag, match, or lead) and whether that varies by job family. Many organizations match the median broadly but lead at the 75th percentile for a small set of critical roles. Write it down. Without a stated philosophy, every benchmark discussion becomes a negotiation.
2. Choose a defined peer market per job family. Your competitors for software engineers are not your competitors for plant maintenance technicians. Set industry, size, and geographic cuts by job family, and keep them stable year over year so trends are comparable.
3. Blend sources deliberately. Use survey data for structure, posting data for velocity, and government data as a public reference point. Document the weighting. When sources disagree sharply, treat the gap as a signal worth investigating; it often points to a demand shift that hasn't been caught yet.
4. Build bands, then test them against reality. Compare your bands with offer acceptance rates, time-to-fill, and regretted attrition by role. A band that looks competitive on paper but produces repeated offer declines is wrong, whatever the benchmark says.
5. Use the data to audit pay equity. External benchmarks give you a defensible anchor for explaining why two people in the same role are paid differently. They also expose cases where long-tenured employees have drifted below the rates you now pay new employees, a common driver of attrition that rarely appears in exit interviews.
6. Present the case in financial and risk terms. Executives respond to clear trade-offs: “Closing this gap for 140 data engineers costs X annually, compared with an estimated replacement cost of Y for each departure.” Pair the proposed pay adjustment with a cost model and an estimate of retention risk.
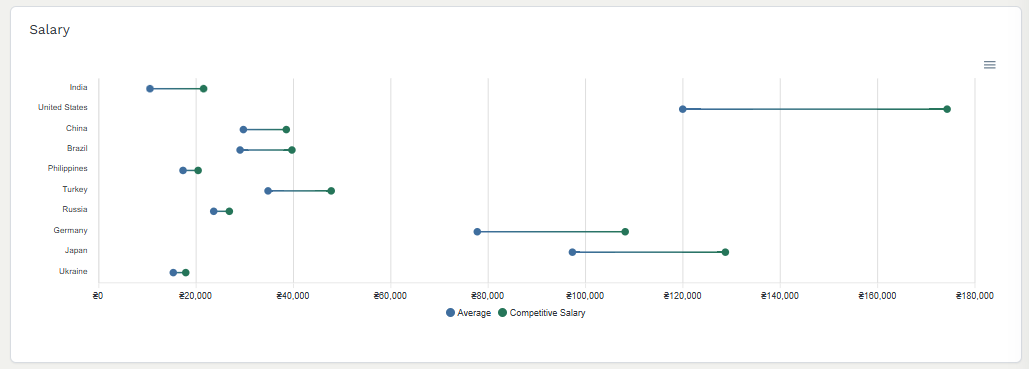
Image shows an example of salary data from Horsefly
From Data Points to Strategic Workforce Intelligence
A salary benchmark answers one question: what does this role cost here? Workforce strategy asks harder ones. Where should we build our next engineering hub? Can we staff a new plant within 18 months? Should we hire this capability or develop it internally?
Answering those requires combining external data (compensation, talent supply, demand pressure, competitor recruitment activity) with internal data on your own labor force: current pay positioning, skills inventory, attrition patterns, and succession depth. Compensation figures examined in isolation can point you toward a low-cost location that lacks the talent depth to support your hiring plan.
This is the problem we built Horsefly Analytics to solve. Our talent intelligence platform brings global labor market data together so that compensation, supply, and demand can be read side by side across countries and cities, rather than assembled by hand from incompatible national sources. For our clients, the payoff shows up in location planning, labor force forecasts that account for local pressure, and compensation decisions that leadership can trust because the evidence behind them is consistent.
The organizations that recruit well in tight markets don't necessarily pay the most. They know earlier than their competitors where pay is moving, which capabilities are getting scarcer, and where the talent actually sits.
Learn how Horsefly's Talent Intelligence Platform provides real-time, global compensation data for strategic decision-making.

Frequently Asked Questions
What are the best sources for accurate salary market data?
Accurate salary data typically comes from government statistics, commercial survey providers, and staffing firm reports. Each source offers unique insights: government data provides broad, statistically rigorous public benchmarks, while commercial surveys offer detailed, employer-reported compensation. Staffing firms share real-time recruitment insights.
How do you choose the right salary data source for a specific hiring decision?
Select a source based on your specific need: use commercial surveys for structured pricing, posting aggregations for current market velocity, and government data for a public, defensible baseline. For specific roles in active recruitment, staffing firm insights are valuable for calibrating offers effectively.
How should I interpret salary percentile data when building pay ranges?
When building pay ranges, the 50th percentile represents the compensation rate for a competent employee. The 25th percentile often suits developing proficiency, while the 75th percentile targets experienced talent or lead-the-market roles. The 90th percentile is for top performers or rare capabilities.
Why is using free or crowd-sourced salary data risky for business decisions?
Free and crowd-sourced salary data carries risks like self-reporting bias, weak validation, and inconsistent position matching, as contributors are not a random sample and data quality is difficult to verify. This can lead to inaccurate benchmarks that misinform critical enterprise compensation decisions.
What steps should I take to apply salary data effectively in my compensation strategy?
First, define your compensation philosophy (lag, match, or lead the market). Then, choose a defined peer market per job family and deliberately blend various data sources. Build pay bands, test them against actual recruitment outcomes, and audit for pay equity. Present findings with cost and risk implications.
How do global companies manage salary benchmarking across multiple countries with inconsistent data?
Global companies often face challenges due to varied national sources, different occupation codes, and inconsistent pay definitions. They typically need to stitch together multiple national data sources, which can introduce errors. Integrating talent intelligence platforms that consolidate global labor data can provide consistent cross-country insights.
Sources: Horsefly Analytics, Bureau of Labor Statistics, Salary.com