Contents:
-
Why Spreadsheets Fail in Global Salary and Compensation Strategy
-
Essential Features for Enterprise-Grade Salary Benchmarking Tools
-
Managing Pay Equity and Transparency Mandates with Confidence
-
A Framework for Comparing Top Benchmarking and Compensation Management Solutions
-
Make More Informed Global Compensation Decisions with Horsefly Analytics
Key Takeaways:
1. Interrogate the data source before comparing features. Every vendor claims global data, real-time insights, and easy integration, so the useful questions are how the data is collected, how it’s validated, and what coverage looks like in your actual cities and job families. Each source has known biases: surveys lag, customer payroll data skews toward the vendor’s client base, crowdsourced data skews toward people motivated to share, and job postings show advertised ranges rather than final pay. Also check that the platform shows sample sizes behind each median and filters by skills, not just titles.
2. Decide whether you need a compensation tool or a workforce intelligence tool. A benchmarking tool tells you what to pay for a role. A labor market intelligence platform also shows whether the talent is available at all, how competitive a location is, and what it would cost to build a team there. For site selection or engineering hub decisions, that second question often matters more. Benchmarking also shows where the market is, but whether to lead, match, or lag it by job family remains a business decision.
3. Fix job architecture before implementation, and design for pay equity from the start. If the same role has four titles across three regions, or legacy codes from acquisitions linger, the software will produce unreliable comparisons. For compliance, regression-based analysis separates gaps explained by level, location, and role from those needing remediation, and audit-ready reports should come from a single versioned data set. Under the EU Pay Transparency Directive, a gap of at least 5% within a worker category that can’t be justified and stays unaddressed for six months triggers a joint pay assessment, so a costed, phased remediation plan is much easier for finance to approve than a vague commitment.
—-----------------------------------------------------
A salary range built on last year's survey data for a single country will misprice talent the moment you hire across five international locations. That’s why having the right tools to reliably compare salary data across markets is essential.
Below, we lay out the features that separate enterprise-grade compensation benchmarking software from lightweight salary lookup tools, a framework for comparing vendors, and the questions to put to any provider before you sign.
Why Spreadsheets Fail in Global Salary and Compensation Strategy
Most global compensation functions still run on a workbook, where someone exports HRIS data, pastes in survey results purchased once a year, adds currency conversions by hand, and emails version 14 to regional HR partners. Most enterprises have some version of this file, or even several versions that disagree.
These spreadsheets fail in three specific ways that cost money.
The Data is Stale on Arrival
Annual salary surveys reflect what employers paid months before publication. In fast-moving skill markets such as cloud security, machine learning, quantitative risk, or automation engineering, a six-month lag can put your ranges well behind where candidates are actually landing offers. Recruiters discover this when offers get declined, and by then the role has been open for weeks.
The Data Has Gaps Exactly Where You Need It
Survey coverage is strongest for large metros and common job families. But when you try to benchmark a lesser-known job in a secondary city, you end up extrapolating from a capital-city figure with a geographic differential someone set three years ago. These estimates are simply not accurate.
Nobody Can Audit the Logic
When a regulator, works council, or employee asks how a pay range was set, "cell F212 references a tab that references a survey from 2022" is not a defensible answer.
The downstream costs show up in two places:
Underpricing roles drives up hiring costs through longer vacancies, agency fees, and counteroffer bidding wars. Underpaying existing staff relative to the market drives talent attrition, usually among the high performers who have the most outside options.
Overpaying is the quieter failure: you win candidates but inflate your cost base for years, and no one notices because there is no reliable market reference to compare against.
Teams that ditch spreadsheets usually do it to reduce manual processes, but the bigger gain is replacing unreliable market data with something you can defend in a budget review.

What is Compensation Benchmarking Software?
Compensation benchmarking software compares your internal pay structures against external market data so you can set ranges, price offers, and plan increases with evidence rather than precedent.
The tools on the market fall into roughly four types:
-
Survey-based benchmarking platforms that package traditional salary survey data into a searchable interface. This is reliable for well-defined jobs in well-covered markets, but slower to reflect shifts.
-
Compensation planning and workflow tools focused on running merit cycles, approvals, and budget allocation. Some include market data, but many expect you to bring your own.
-
Equity and startup-focused tools built around cap tables and equity grants, with benchmarking drawn from their customer base. These are strong for venture-backed tech companies, but narrower for a global manufacturer.
-
Labor market intelligence platforms that combine compensation data with talent supply, demand, and location data, aggregated from large volumes of job postings, profiles, and other sources.
A salary benchmarking tool tells you what you should pay for a specific role, whereas a labor market intelligence platform also answers whether the role should be available at all, and how hard it will be to fill. For enterprises doing serious workforce planning, that second question often matters more.
The core purpose across all of them is to move compensation planning from reactive adjustments (matching a counteroffer, fixing a range after a resignation) to proactive decisions tied to where the business is going.
Essential Features for Enterprise-Grade Salary Benchmarking Tools
In our experience, four capability groups decide whether a platform will hold up in a global enterprise.
Data and Analytics
Start with the data, because every other feature depends on it. Look for:
-
Real-time market data or frequent refresh cycles. Ask how often figures update and what the lag is between a market move and its appearance in the platform.
-
Granular location filtering. Country-level medians are close to useless for a multinational company. You need city-level and ideally sub-regional figures, because pay for the same role can vary widely between two cities in the same country.
-
Skill-level filtering, not just job titles. Job titles drift between industries, so only filtering by skills can get you to a real comparison.
-
Sample size visibility. If the platform shows a median without telling you how many data points sit behind it, treat the figure with suspicion.
Reporting and analytics should let your team build views for different audiences, such as a range recommendation for a hiring manager, a cost model for finance, or a regional breakdown for the board.
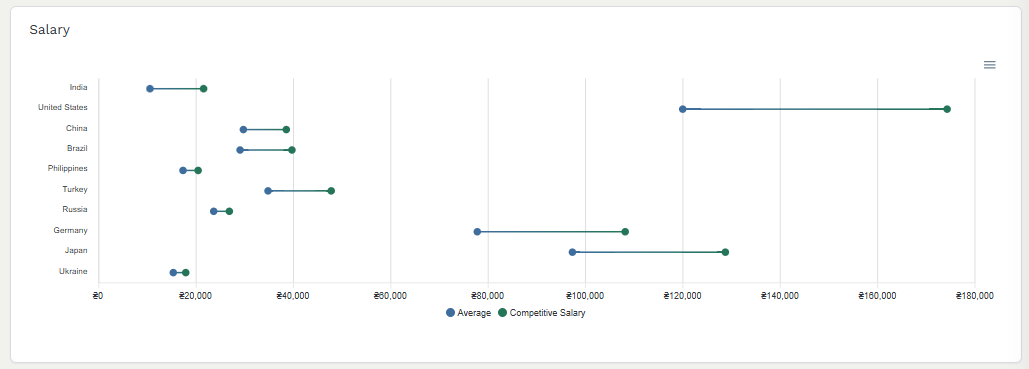
Example Salary data from Horsefly
Total Rewards Management
Base salary is often the smaller half of the comparison for senior and specialist roles. A strong platform lets you model total rewards, like base, short-term incentives, long-term incentives, equity, and allowances. This allows you to compare offer packages on a comparable basis across markets where the mix differs.
This matters most in technology and finance, where equity and a bonus can exceed base salary at senior levels. If your tool benchmarks base pay alone, your ranges may look competitive while your packages are not. Look for the ability to model scenarios as well. For example, what happens to total cost if you shift bonus targets by five points in one region, or replace cash allowances with equity in another?
Pay Equity and Compliance
Compliance tools should let you identify pay gaps by gender and other protected characteristics, control for legitimate factors such as level, location, and tenure, and produce reports in formats regulators accept. We cover this in detail below, but the general test is whether the platform shows not only that a gap exists, but whether it can be explained by objective criteria.
Integration
HRIS integration determines whether the platform becomes part of how your team works or a separate login people forget about. At minimum, you need reliable import of employee, job, and pay data from your HRIS, and ideally a link to your ATS so recruiters see market ranges at the point of offer. Without integration, you rebuild the spreadsheet problem with a nicer interface.
Gain a Competitive Edge in the Global Talent War
Accurate benchmarking shows up first in the offer letter.
When a recruiter knows the actual market range for a skill set in a specific city, they can make an offer that lands on the first try. That shortens time-to-hire, cuts the back-and-forth that loses job candidates to faster competitors, and keeps hiring managers from padding offers "to be safe." The goal is to pay enough to win, and no more.
Accuracy cuts both ways. We regularly see companies paying well above market for roles where talent supply is ample, simply because no one checked. In a competitive job market for niche skills, the budget you save on oversupplied roles is what funds aggressive offers for the scarce ones.
Retention follows the same logic, applied to people you already employ. Most employees now have a reasonable idea of their market value thanks to job postings with salary ranges and peer conversations. When internal pay drifts below market, the people who notice first are the ones recruiters call most often. Regular benchmarking of your existing workforce, not only new hires, catches that drift before it shows up in resignation letters.
Employee satisfaction with pay depends less on the absolute number than on whether the structure feels fair and explainable. Transparent, defensible pay structures make pay conversations possible, and attracting talent becomes easier when existing employees can vouch for how pay decisions are made.
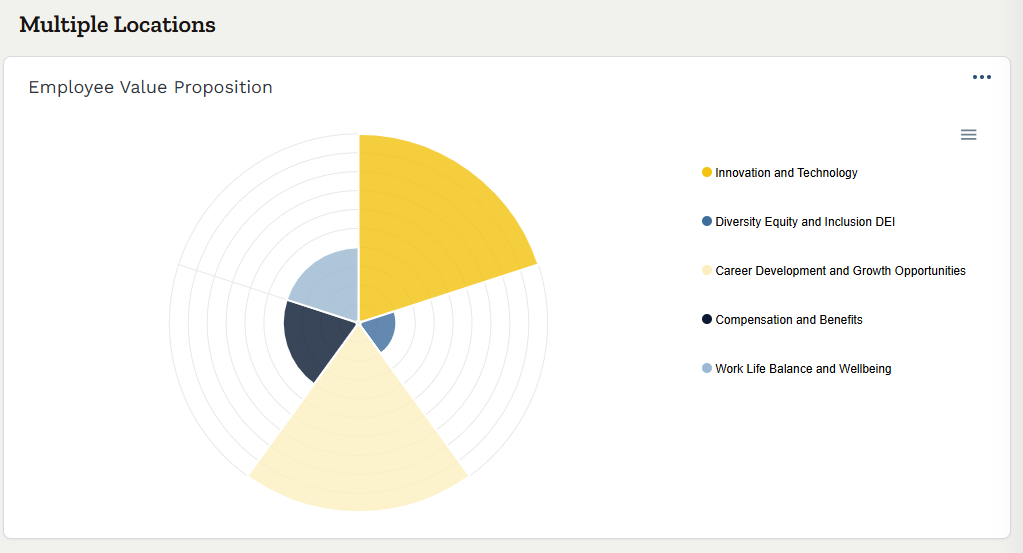
An EVP chart from Horsefly for considering what’s important to different roles
The only caution is that benchmarking shows where the market is, but not where you should position against it. Deciding to lead, match, or lag the market for each job family is a business decision, and the software should support that choice rather than make it for you.
Managing Pay Equity and Transparency Mandates with Confidence
Pay transparency laws are expanding across the US and internationally. Several US jurisdictions, including Colorado, California, New York, and Washington, require salary ranges in job postings, although rules vary by location.
The EU Pay Transparency Directive required member states to transpose its provisions into national law by June 7th 2026, though implementation remains uneven. It introduces pay range disclosure for job candidates, bans questions about salary history, gives employees the right to request pay information, and requires gender pay gap reporting for employers with 100 or more employees. Where a pay gap of at least 5% within a worker category cannot be objectively justified on gender-neutral grounds and remains unaddressed for six months, employers must conduct a joint pay assessment with worker representatives.
For a multinational business, this creates a layered problem. You need ranges that hold up when published, a job architecture that groups "work of equal value" consistently across countries, and documentation that explains every gap.
Compensation software helps in three concrete ways:
1. Running Pay Equity Audits On Demand
Rather than commissioning an annual consultant review, your team can run gap analyzes whenever structures change, after a reorganization, an acquisition, or a merit cycle.
2. Separating Explained From Unexplained Gaps
A raw gender gap tells you little, whereas regression-based analysis that controls for level, location, and role shows which gaps reflect legitimate factors and which need remediation.
3. Producing Audit-Ready Reports
When a regulator or employee representative asks for evidence, you want reports generated from a single, versioned data set, not reconstructed from email attachments.
The hardest part is that fixing identified disparities costs money, and the remediation budget conversation with finance is where many equity programs stall. Good data helps here too, because a costed remediation plan, phased over defined cycles and tied to specific employees, is much easier to approve than a vague commitment to fair pay.
The risk of doing nothing is concrete. Under the EU directive, the burden of proof in pay discrimination cases shifts to the employer, and penalties are set nationally. Beyond fines, published salary ranges make inconsistencies visible to every candidate and employee, and that reputational exposure is hard to reverse.

A Framework for Comparing Top Benchmarking and Compensation Management Solutions
Most comparison articles list vendors and features side by side. That approach fails because every vendor claims global data, real-time insights, and easy integration. Ask these four questions instead.
1. Salary Data Source and Methodology
This is where vendors differ most and disclose least.
-
How is the data collected? Employer-submitted surveys, customer payroll data, job postings, crowdsourced employee reports, or a combination? Each has known biases. For instance, surveys lag, customer data skews toward the vendor's client base, and crowdsourced data skews toward people motivated to share. Job postings reflect advertised ranges rather than final pay.
-
How is it validated? Ask how outliers are handled, how job matching works, and how the vendor detects and corrects bias in its sources.
-
What is the real global reach? Request coverage data for your actual footprint, including the specific cities and job families where you hire.
2. Platform Scalability
Can the platform handle tens of thousands of employees, multiple currencies, several job architectures from acquired businesses, and regional HR teams with different permission levels? Ask for references from customers of comparable size and complexity.
3. Scope of Insight
Decide whether you need a compensation tool or a workforce intelligence tool. If you need to know more than just what to pay, including where talent is available, how competitive a location is, and what it will cost to build a team there, you need labor market intelligence alongside pay data.
4. Integration and Support
Ask what the integration with your HRIS looks like in practice. Who does the mapping work? What does onboarding support include after go-live?
The Horsefly Advantage: Unmatched Global Data Intelligence
We built our Horsefly Analytics platform for organizations whose questions go beyond pay. Here is how we measure up against the same framework.
Data Source and Global Reach
At Horsefly Analytics, we draw on more than 1 trillion data points, giving us the widest global data reach in the category. The practical result is coverage where traditional surveys run thin. When your team needs to price a role in a secondary city, we provide granular insights for more than 170,000 towns and cities, so you can work from local market evidence instead of a capital-city figure and a rough adjustment.
Scope of Insight
Our platform combines compensation data with wider labor market intelligence. Instead of asking only what a role pays in a certain city, you can ask how that compares with talent availability there, and weigh it against alternative locations before committing to a site. For manufacturing leaders planning a new facility or technology leaders deciding where to build an engineering hub, that comparison is often the decision that matters most.
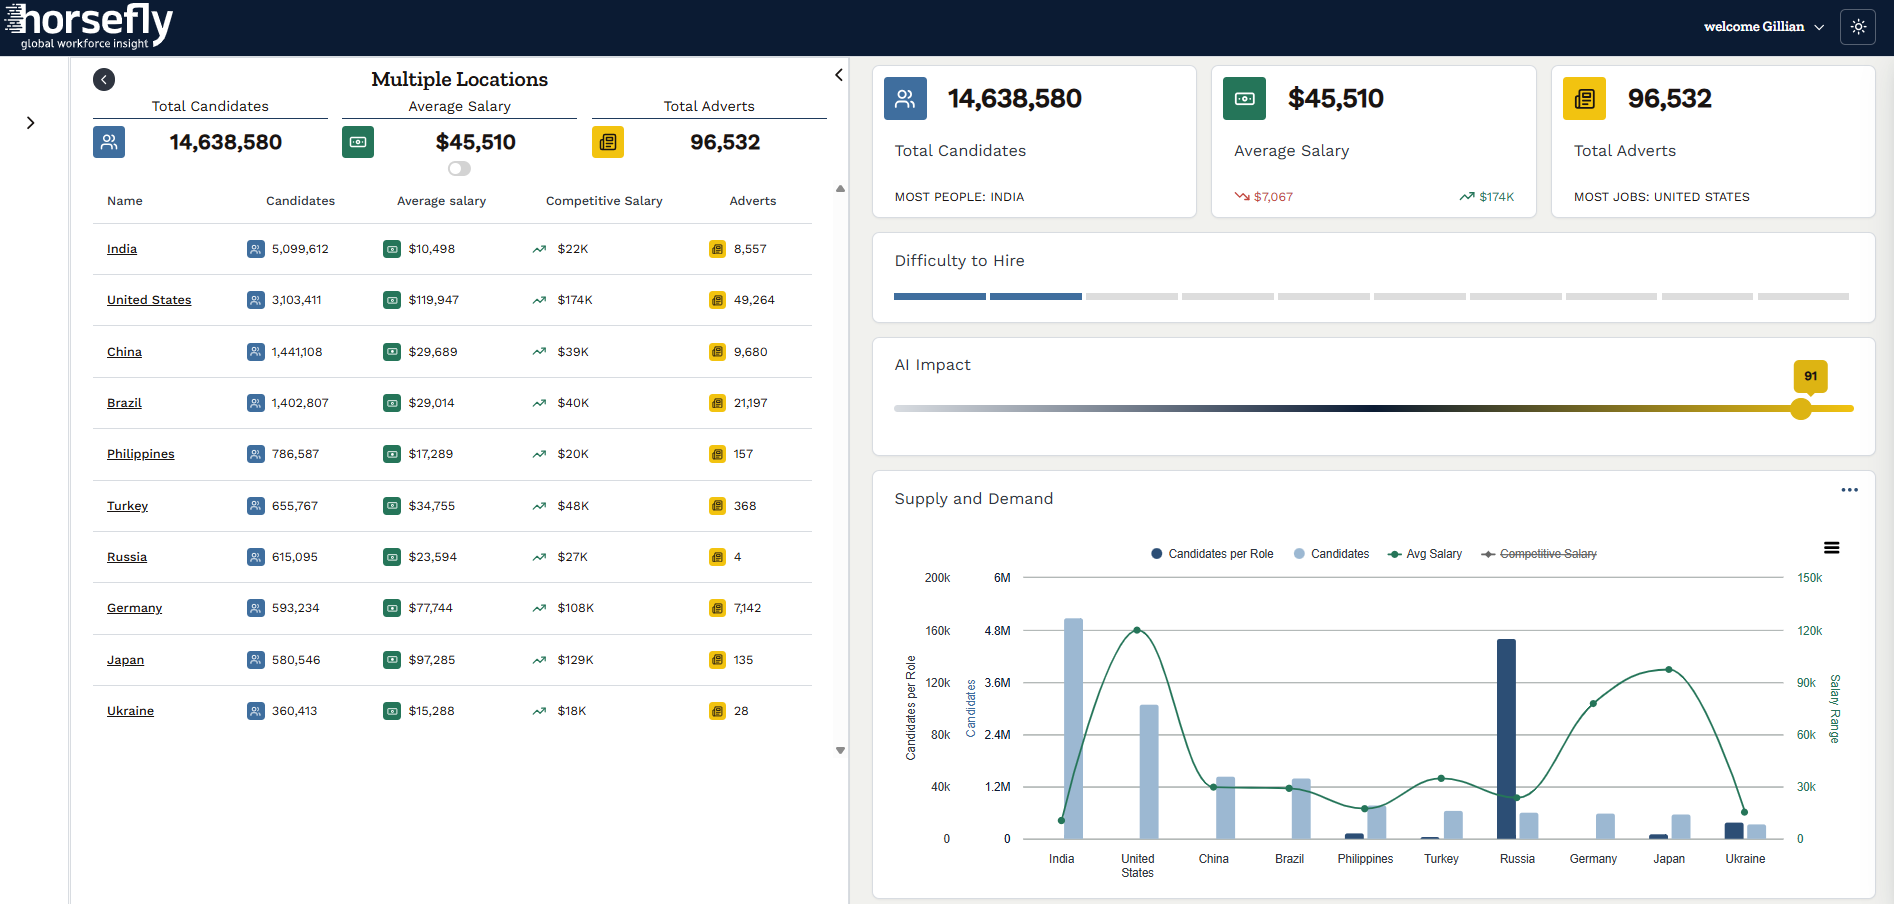
A view of the data from the Horsefly platform showcasing average salaries, locations etc. when looking at various factors for different roles
Combining External and Internal Data
Our platform lets you combine external market data with your internal talent data, so you can see your own workforce against the market, including which teams are drifting below range, where your cost base exceeds local benchmarks, and which locations offer room to grow. This is the basis for complete workforce planning, connecting compensation, location strategy, and talent supply in one view rather than three disconnected projects.
Integrating Benchmarking Software into Your HR Tech Stack
Start With Job Architecture, Not Software
Inconsistent job architecture can undermine compensation benchmarking before implementation even begins. The same role might have four different titles across three regions, job levels might mean different things across business units, and legacy job codes from acquisitions might remain in use long after the deal closes. Benchmarking software can only work with the data it receives, so inconsistent job structures can lead to unreliable market comparisons. Before rolling out a new platform, set aside time to standardize job families, titles, and levels, either ahead of implementation or as part of it.
Define the Single Source of Truth
Decide which system owns which data. Typically, the HRIS owns employee and job records, the benchmarking platform owns market data and range recommendations, and payroll owns actual pay. Integration should move data between them on a defined schedule, with clear ownership when records conflict.
Treat Data Migration as a Project
Historical pay data, existing ranges, and prior survey matches all need mapping. Expect data quality issues to surface, such as missing location fields, employees coded to the wrong cost center, or currencies stored inconsistently. Fixing these is tedious work, and it improves every HR analytics effort you run afterward, not just benchmarking.
Plan for User Adoption by Role
Different teams use compensation benchmarking software in different ways, so training should reflect their needs. Compensation specialists need in-depth training to manage data and analyze market rates, while recruiters need quick access to salary ranges during the offer process, ideally within their ATS. Hiring managers need a straightforward view of pay ranges and how they're determined, while executives need concise summaries to support decisions. Tailoring training to each group helps ensure the platform fits into existing workflows and gets used effectively.
Phase the Rollout
Start with one region or job family where the pain is acute, often a hard-to-fill technology function, and prove value there. A visible early result, such as faster offer acceptance in one team, does more for adoption than any internal communications campaign.
Maximizing ROI on HR software Comes Down to Usage
A platform that only the compensation team opens twice a year is an expensive survey subscription. One that recruiters, workforce planners, and finance all draw on becomes part of how the business decides where and how to grow.
Make More Informed Global Compensation Decisions with Horsefly Analytics
Choosing compensation benchmarking software is about more than finding the right salary range. Global HR leaders need to understand what talent costs in different markets, where the skills they need are available, and how location decisions will affect workforce budgets.
Horsefly Analytics brings these insights together in one platform, combining global compensation data with talent supply and demand, skills intelligence, and location comparisons. With data covering more than 170,000 towns and cities, you can compare potential hiring markets, assess talent costs, and make workforce plans based on evidence rather than outdated benchmarks or assumptions.
Whether you're expanding into new markets, building specialist teams, or reviewing your global workforce strategy, Horsefly helps you connect compensation decisions with the wider talent landscape.
Ready to see what Horsefly can do for your workforce planning? Book a strategic consultation to explore the platform and see how its data can support your organization's specific roles, locations, and workforce goals.

Frequently Asked Questions
What are the main problems with using spreadsheets for global compensation strategy?
Spreadsheets often contain stale data from annual surveys, have significant gaps for niche roles or secondary locations, and lack clear audit trails for pay decisions. This leads to underpricing roles, increased hiring costs, higher talent attrition, and a lack of defensible pay structures.
What essential features should global HR leaders look for in enterprise compensation benchmarking software?
Enterprise-grade compensation software requires real-time, granular market data filtering by location and skills, comprehensive total rewards management, robust pay equity and compliance tools, and seamless integration with existing HRIS and ATS systems. These capabilities ensure accurate and defensible pay strategies.
How can compensation benchmarking software help ensure pay equity and regulatory compliance?
Compensation software facilitates on-demand pay equity audits, distinguishing between legitimate and unexplained pay gaps using regression analysis. It also generates audit-ready reports from a single data set, crucial for meeting global transparency mandates and defending pay structures to regulators or employees.
What key questions should I ask when evaluating compensation benchmarking software vendors?
When evaluating vendors, ask about their data collection and validation methodology, their platform's scalability for large global workforces, the scope of insight provided (compensation vs. broader workforce intelligence), and the specifics of HRIS integration and post-implementation support.
What is the difference between a compensation benchmarking tool and a labor market intelligence platform?
A compensation benchmarking tool primarily answers 'what should we pay for this role?' by comparing internal pay to external market data. A labor market intelligence platform goes further, also providing insights into talent supply, demand, and location feasibility, helping decide where to place a role.
How do you successfully integrate new compensation benchmarking software into an existing HR tech stack?
Successful integration begins with rationalizing your job architecture and defining a single source of truth for data. It involves meticulous data migration, planning for data quality issues, and developing tailored user adoption training programs for different roles, often phased by region or job family.
What are the typical costs associated with implementing compensation benchmarking software?
The costs of implementing compensation benchmarking software typically include licensing fees (subscription-based), initial setup and configuration, data migration, and ongoing training. Additional costs can arise from custom integrations or extensive job architecture redesigns required to optimize data accuracy and system performance.
Sources: Horsefly Analytics, EU Pay Transparency Directive, PwC