.png?width=2000&name=Horsefly-Logo-NewTag_White%20(3).png)
Workforce analytics has moved beyond traditional HR reporting. Instead of simply tracking headcount and turnover, enterprises can use workforce data to support decisions around hiring, compensation, workforce planning, and business expansion.
A well-built dashboard connects workforce data to business outcomes, helping leaders understand not only what is happening but also why and what may happen next.
For global organizations, this can mean comparing talent availability across markets, identifying workforce risks, and aligning hiring plans with business goals.
Core Capabilities of an Enterprise-Grade Analytics Dashboard
Not every dashboard earns the "enterprise-grade" label. The market is crowded with tools that look impressive in demos but buckle under the weight of real global workforce complexity. Here's what actually matters.
Data Integration That Handles Complexity
An enterprise operates across multiple HRIS platforms, applicant tracking systems, payroll providers, learning management systems, and performance tools. Often different ones in different regions. The dashboard must pull from all of them. This means strong API connectivity, support for flat-file ingestion as a fallback, and the ability to normalize data across systems that define "department" or "job level" differently.
The real test isn't whether the tool connects to Workday. It's whether it can reconcile a Workday instance in North America with an SAP SuccessFactors instance in Europe and a local payroll system in Southeast Asia, then present a unified view.
Visualization That Drives Action
Charts and graphs are table stakes. What separates useful visualization from decorative visualization is configurability. Leaders in different functions need different views. A talent acquisition VP cares about time-to-fill by market and role. A workforce planning director cares about headcount projections against demand forecasts. A CHRO cares about cost, risk, and readiness at the portfolio level.
Look for heatmaps that overlay talent supply against demand geographically, drill-down capabilities that let you move from global summary to individual market, and the ability to build custom views without needing a data engineering team.
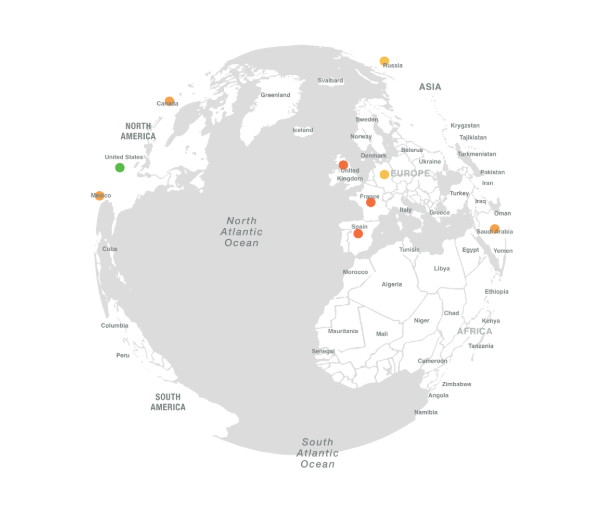
A view of the heat map functionality in Horsefly
Predictive Modeling
Descriptive analytics tells you what happened. Predictive modeling tells you what's likely to happen. At the enterprise level, this means forecasting attrition risk by segment, projecting skills gaps based on business growth plans, and modeling the talent availability impact of opening a new location in a specific market.
The accuracy of these models depends entirely on data quality and volume, which circles back to integration. A model trained on incomplete data produces unreliable predictions.
Configurable Reporting and Alerts
Enterprise dashboards need to support both scheduled reporting (monthly board decks, quarterly business reviews) and real-time alerting. If a key talent market suddenly tightens, or compensation benchmarks shift by more than a set threshold, the right people should know immediately rather than discovering it in next quarter's report.
From Hindsight to Foresight: The Four Types of Workforce Analytics
Analytics capabilities exist on a spectrum, and understanding where your organization sits on that spectrum is useful for setting realistic expectations.
Descriptive analytics answers "what happened."
Quarterly turnover rates by region, hiring volume by business unit, diversity representation over time. Most enterprises have this covered, though the data is often scattered and inconsistent.
Diagnostic analytics answers "why it happened."
This is where things get interesting. Correlating attrition spikes with manager tenure, linking engagement survey results to specific team structures, or identifying that compensation competitiveness dropped in a particular market three months before departures accelerated. Diagnostic analytics requires connected data sources and enough historical depth to identify patterns.
Predictive analytics answers "what will likely happen."
Flight risk scoring at the individual or segment level. Demand forecasting based on business plans and pipeline data. Skills availability projections based on labor market trends. This is where most global enterprises want to be and where many stall out, usually because the data foundation isn't solid enough.
Prescriptive analytics answers "what should we do about it."
This is the frontier. Given that attrition in your Berlin data engineering team is predicted to rise 12% over the next two quarters, prescriptive analytics recommends specific interventions: adjust compensation to the 65th percentile, activate internal mobility from your Warsaw team, or pre-build a sourcing pipeline in an alternative market. We see growing demand for this capability among our clients, particularly those managing complex, multi-market talent strategies.
The mistake most enterprises make is trying to jump straight to predictive and prescriptive without getting descriptive and diagnostic right first. You can't predict what you can't consistently measure.
The AI Advantage: How Machine Learning Elevates Workforce Intelligence
AI and machine learning have become heavily marketed terms in HR technology. Here's where they actually deliver value in workforce analytics, versus where they're mostly hype.
Predictive accuracy improves with ML algorithms that learn from your specific organizational patterns rather than relying on industry averages. A machine learning model trained on your company's historical attrition data, incorporating variables like compensation ratio, tenure, promotion velocity, manager changes, and commute time, will outperform a generic "years since last promotion" rule every time. But it needs sufficient data volume and quality to work.
Natural Language Processing (NLP) opens up unstructured data. Employee survey comments, Glassdoor reviews, exit interview transcripts, and internal communication sentiment: these contain signals that structured data misses. NLP can surface emerging themes (concerns about career development in a specific business unit, for example) months before they show up in engagement scores or turnover numbers.
Anomaly detection catches things humans miss at scale. When you're monitoring workforce metrics across 40 countries and hundreds of cost centers, ML models can flag unusual patterns (a sudden spike in overtime in one facility, an unexpected drop in application rates for a previously popular location) that would otherwise go unnoticed until they become problems.
Where we'd caution restraint: "agentic AI" that makes autonomous workforce decisions is still early. The technology is promising, but the governance frameworks, ethical considerations, and organizational trust required to let AI take action (rather than recommend action) aren't mature enough in most enterprises. Use AI to surface insights and recommendations. Keep humans in the decision loop.
Creating a Single Source of Truth: Integrating with Your HR Tech Stack
Data integration is the difficult topic that determines whether your analytics investment succeeds or becomes shelfware. We've seen it both ways.
The goal is a unified data architecture where your analytics dashboard serves as the connective tissue across an HRIS, HCM suite, ATS, payroll, LMS, and performance management tools. The ideal state: a single source of truth that every stakeholder trusts.
Getting there is harder than vendors typically suggest.
Real-world integration challenges include inconsistent data taxonomies (one system uses "Software Engineer III," another uses "Senior Developer"), different refresh cycles (real-time ATS data alongside monthly payroll extracts), data quality issues in source systems, and privacy constraints that vary by jurisdiction. In the EU, you may not be able to pull the same employee-level data that's available in your US systems.
Strong API-based integrations are the baseline. But equally important is a strong data transformation layer that normalizes, deduplicates, and validates data before it hits the dashboard. If the underlying data is messy, no amount of beautiful visualization will produce trustworthy insights.
At Horsefly Analytics, one of our core strengths is the ability to merge external labor market intelligence with an organization's internal HR data. This combination is what produces genuinely strategic insight. Your internal data tells you what's happening inside your walls. External market data tells you what's happening outside them. The intersection is where decisions get made: should we compete harder for talent in this market or redirect to an alternative location where supply is stronger, and costs are lower?
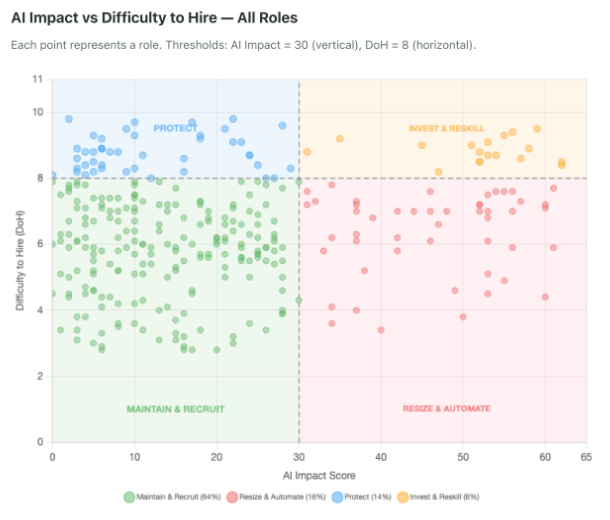
Image shows an example of using internal and external data, within Horsefly Enterprise, to determine the best action to take
Understanding Business Value: Key Benefits for Strategic HR and Growth
The benefits of workforce analytics dashboards are real, but they manifest differently depending on organizational maturity and use case. Here's how we see them break down in practice.
Talent Optimization
Attrition is expensive. Replacement costs for a professional-level employee typically run between 50% and 200% of annual salary when you account for lost productivity, recruiting, onboarding, and ramp-up time. A dashboard that accurately identifies at-risk populations and the factors driving their departure gives you a window to intervene.
Equally important: improving hiring quality. When you can benchmark candidate profiles against performance data from successful hires in similar roles, you start improving for outcomes rather than credentials.
Operational Efficiency
Workforce planning without analytics is largely guesswork. How many people do we need, in what roles, in which locations, by when? Dashboards that connect demand forecasts to labor market supply data and internal pipeline visibility reduce both overstaffing and last-minute scrambles to fill gaps.
Skills gap analysis is a specific capability worth highlighting. As business strategies shift (AI adoption, market expansion, product pivots), the skills profile of your workforce needs to shift too. Analytics dashboards that map current skills inventory against future requirements give you lead time to build, buy, or borrow the capabilities you'll need.
Financial Impact
Every workforce decision has a cost dimension. Location strategy, compensation design, contingent labor mix, and recruitment channel effectiveness: these are all areas where analytics drives better financial outcomes. When you can model the fully loaded cost of hiring a data scientist in San Francisco versus Toronto versus Krakow, including compensation, taxes, benefits, and real estate, the conversation changes from opinion-based to evidence-based.
DE&I Progress
Representation metrics are the starting point, not the endpoint. Effective dashboards track diversity through the entire talent lifecycle: sourcing, screening, interviewing, hiring, promotion, retention, and exit. This visibility surfaces where bias or systemic barriers exist, which is far more actionable than a single annual diversity report.
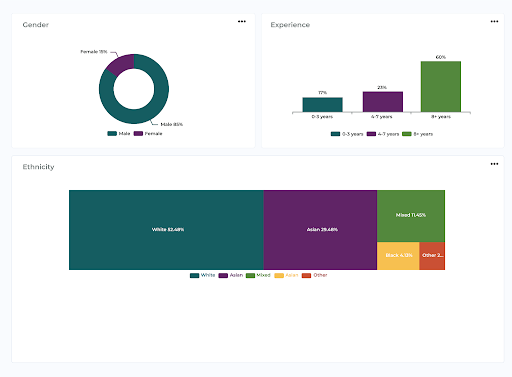
A view of how diversity data can appear within Horsefly
Measuring the Impact: Calculating the ROI of Your Analytics Platform
Workforce analytics ROI should be tied to measurable business outcomes, such as lower hiring costs, reduced attrition, and faster time-to-fill.
For example, reducing a $4,500 cost-per-hire by 15% saves $675 per hire. At 5,000 hires a year, that would equal $3.375 million in potential savings.
Attrition can have an even larger impact. If a 10,000-person workforce has 15% turnover and each replacement costs $40,000, a two-percentage-point reduction would save $8 million. These figures are illustrative, as costs vary by organisation.
To build the business case, identify your largest workforce costs, establish baseline metrics, set realistic improvement targets, and compare the potential savings with platform and implementation costs.
Choosing Your Strategic Partner: Key Vendor Selection Criteria
The vendor market for workforce analytics is fragmented, with different players strong in different areas. Here's what to evaluate.
Data Capabilities
How broad is the vendor's data coverage? For global enterprises, this is the first filter. Many platforms have strong data in the US or Western Europe but significant blind spots in emerging markets, Asia-Pacific, or Latin America. If you're making global workforce decisions, you need global data. At Horsefly Analytics, our data covers over 190 countries, which reflects our belief that partial data leads to partial (and often wrong) conclusions.
Analytical Depth
Does the platform stop at descriptive reporting, or does it support diagnostic, predictive, and prescriptive capabilities? Can it model scenarios (what happens if we shift 200 roles from London to Lisbon)? Can it benchmark your internal data against external market realities?

Scalability
Will the platform handle your organization's growth? Not just in headcount, but in complexity: new markets, acquisitions, restructuring, and new data sources.
Security and Compliance Architecture
More on this in the next section, but it belongs on the vendor checklist. Ask specific questions about encryption, access controls, data residency, and regulatory compliance.
User Experience and Adoption
The most powerful analytics platform delivers zero value if people don't use it. Evaluate the interface with actual end users, not just the analytics team. Can a CHRO get answers quickly? Can a regional TA leader build a custom view without filing a support ticket?
Pricing Transparency
Models vary widely: per-user, per-module, platform fee plus consumption, and enterprise license. Understand not just the initial cost but the total cost at full deployment, including implementation, training, and ongoing support.
Protecting Your People Data: Security and Compliance Essentials
Workforce data is among the most sensitive data an organization holds. A breach doesn't just create legal liability; it destroys employee trust in ways that take years to rebuild.
Non-negotiable technical requirements include end-to-end encryption (in transit and at rest), role-based access controls that limit data visibility by function, geography, and seniority, multi-factor authentication, and audit logging that tracks who accessed what data and when.
For global enterprises, compliance complexity multiplies fast. GDPR in the EU imposes strict requirements on data processing, consent, and the right to erasure. CCPA in California has its own framework. China's PIPL, Brazil's LGPD, and India's DPDP Act each add another layer.
Your analytics platform must support data residency requirements (keeping EU employee data within the EU, for example) and provide mechanisms for data anonymization and aggregation that enable analytics without exposing individual-level information where regulations prohibit it.
Ask vendors for specifics:
-
What certifications do they hold (SOC 2, ISO 27001)?
-
Where are their data centers?
-
How do they handle cross-border data transfers?
-
What's their breach notification process?
Vague answers to these questions are a red flag.
Regular security audits, both internal and third-party, should be part of the ongoing governance model. Data ethics policies governing what questions are and aren't appropriate to answer with people's data are equally important and often overlooked.
From Plan to Platform: A Realistic Look at Implementation
We'll be direct: implementation is the phase where most analytics initiatives either succeed or quietly die. The technology is rarely the bottleneck. Change management, data readiness, and organizational alignment are.
Phase 1: Discovery and Goal Setting (4 to 6 weeks)
Define what decisions the dashboard needs to support. Identify 3 to 5 priority KPIs tied to business outcomes. Map existing data sources and assess quality. This phase should involve business leaders, not just HR and IT.
Phase 2: Data Integration and Validation (6 to 12 weeks)
Connect source systems, build transformation logic, and validate data accuracy. This is almost always the longest phase and the most underestimated. Budget more time than you think you need.
Phase 3: Configuration and User Training (4 to 6 weeks)
Build dashboards, reports, and role-specific views. Train different user groups on the functionality relevant to them. One-size-fits-all training doesn't work; a CHRO needs different training than a workforce planning analyst.
Phase 4: Pilot and Rollout (4 to 8 weeks)
Start with a defined scope (one region, one business unit, one use case) and expand based on feedback. Collect user feedback aggressively during the pilot. The issues surfaced here are far cheaper to fix than post-rollout.
Total timeline for an enterprise deployment: typically 5 to 8 months from kickoff to full rollout, assuming reasonable data readiness. Organizations with highly fragmented or low-quality source data should add 2 to 3 months for data remediation.
The single biggest risk factor? Lack of executive sponsorship. Without a senior leader (ideally the CHRO or COO) actively championing the initiative and holding teams accountable for adoption, analytics dashboards become expensive toys that get opened once a quarter.
Building Your Future Workforce with Global Intelligence
The enterprises that will win the global competition for talent over the next decade won't be the ones with the biggest recruitment budgets. They'll be the ones that make smarter decisions, faster, based on data that spans both internal workforce dynamics and external market realities.
A workforce analytics dashboard, properly built and adopted, is the mechanism that makes this possible. It connects the dots between attrition trends and compensation competitiveness, between hiring targets and labor market supply, between business expansion plans and talent availability in target markets.
At Horsefly Analytics, we built our platform around a conviction that global workforce decisions deserve global data. Our ability to merge external labor market intelligence across 190+ countries with our clients' internal HR data creates the complete picture that fragmented tools and manual research simply cannot. When you can see both what's happening inside your organization and what's happening in the markets where you compete for talent, you make better decisions about where to hire, what to pay, how to retain, and where to grow.
The gap between organizations that use workforce analytics strategically and those that don't is widening. If you're ready to close that gap, we'd welcome the conversation.

Frequently Asked Questions
How does enterprise workforce analytics differ from traditional HR reporting?
Enterprise workforce analytics moves beyond simply documenting past events. It proactively connects people data to business outcomes, identifying patterns, predicting future trends, and offering actionable intelligence. This strategic approach empowers leaders to make data-driven decisions about talent, rather than just reviewing historical summaries.
What essential features define an enterprise-grade workforce analytics dashboard?
An enterprise-grade dashboard requires robust data integration across diverse HR systems, highly configurable visualizations that drive action for various stakeholders, and accurate predictive modeling capabilities. It also includes flexible reporting and real-time alerting to notify stakeholders of critical workforce shifts and opportunities.
How can organizations calculate the return on investment (ROI) for a workforce analytics platform?
Calculate ROI by quantifying reductions in cost-per-hire, turnover expenses, and time-to-fill, and by valuing avoided costs like poor location decisions. Identify your largest workforce-related cost drivers, establish baselines, project conservative improvement targets, and compare these savings against platform costs.
What are the four main types of workforce analytics capabilities?
The four types are descriptive, showing what happened; diagnostic, explaining why it happened; predictive, forecasting what will happen; and prescriptive, recommending actions to take. Organizations typically progress through these stages, building a solid data foundation before advancing to more sophisticated capabilities.
How does artificial intelligence enhance the value of workforce analytics?
AI improves predictive accuracy by learning from organizational patterns, processes unstructured data like survey comments through Natural Language Processing (NLP) to reveal hidden insights, and uses anomaly detection to flag unusual workforce patterns across vast datasets. AI-driven insights support better, faster decisions.
What common challenges arise during the implementation of an enterprise workforce analytics dashboard?
Key challenges include inconsistent data taxonomies, varying data refresh cycles, poor data quality in source systems, and complex privacy compliance. Successfully navigating these requires robust data transformation, strong executive sponsorship, and effective change management across the organization.
How do workforce analytics dashboards help improve diversity, equity, and inclusion (DE&I) initiatives?
Dashboards track diversity metrics across the entire talent lifecycles: sourcing, hiring, promotion, and retention. This detailed visibility pinpoints specific areas where bias or systemic barriers might exist, enabling organizations to implement targeted, data-backed interventions to foster a more equitable and inclusive workplace.
Sources: Horsefly Analytics, Workday, SAP SuccessFactor, Glassdoor, GDPR, CCPA, PIPL, LGPD, DPDP