The ROI case for workforce analytics is strong, and it shows up in several areas.
Better decisions, faster. When leaders have access to accurate labor market data, they stop relying on assumptions. Location decisions, compensation benchmarking, workforce management and planning - each of these becomes more defensible and more effective.
Reduced costs. Hiring mistakes are expensive. Implementing workforce analytics helps you understand difficulty of hire before you start recruiting, so you can allocate time and budget where they're actually needed. It also surfaces compensation insights that help you compete without overpaying.
Stronger talent attraction and retention. Understanding what drives engagement and what your competitors are offering in terms of benefits and pay lets you build an employee value proposition that actually lands. You're not guessing what people want; you're using data to find out.
Strategic workforce planning. The labor market moves fast. Skills that were abundant two years ago may now be scarce. Workforce planning analytics lets you track those shifts in real time and plan accordingly, whether that means reskilling existing teams, adjusting HR strategies, or identifying new talent pools.
Smarter DEI strategies. Data-driven diversity, equity, and inclusion initiatives are more effective than policy alone. With the right analytics, you can set meaningful benchmarks, track real progress, and identify where gaps exist, not just in your organization but in the broader talent supply.
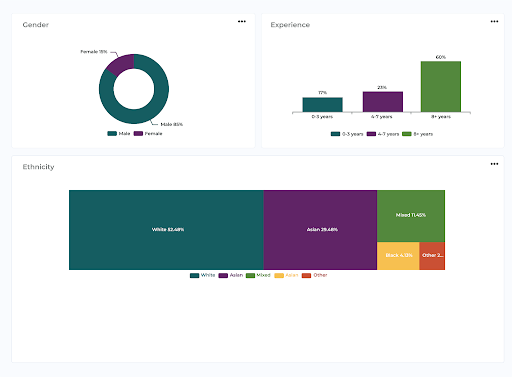
Image shows DEI data from the Horsefly platform
Getting started doesn't have to feel too difficult. Here's a practical approach.
Step 1: Align with business goals. Analytics without a question to answer is just noise. Start by identifying the decisions your organization needs to make better. Are you expanding into a new market? Struggling with early turnover? Planning for the impact of automation? What are your future workforce needs? Let those questions drive your analytics focus.
Step 2: Define your key KPIs. A Key Performance Indicator (KPI) is only useful if it's connected to an outcome you care about. Common HR KPIs include time to hire, cost per hire, employee engagement scores, early turnover rate (the percentage of employees who leave within their first year), and absenteeism rates. Choose the ones that map to your strategic priorities.
Step 3: Invest in the right technology. Spreadsheets will only take you so far. Purpose-built workforce analytics platforms, like Horsefly, give you access to real-time labor market data alongside internal HR data, providing the context your internal numbers alone can't supply. The best platforms are designed to be used by HR professionals and talent strategists, not just data analysts. Get in touch for a custom consultation today.

Step 4: Collect and clean your data. Garbage in, garbage out. Validate your data regularly and make sure it's consistent across systems. This is less glamorous than the analysis phase, but it's what makes the workforce insights trustworthy.
Step 5: Identify actionable insights. The goal isn't a report. It's a data-driven decision. When reviewing analytics output, always ask: what does this mean for what we do next?
Step 6: Monitor and improve. Workforce analytics is not a one-time project. Build in regular review cycles, track your KPIs over time, and refine your approach as business needs evolve.
Data privacy and security deserves its own mention. Ensure all employee data is stored, processed, and accessed in compliance with relevant privacy regulations. Protect data with appropriate encryption and access controls, and be transparent with employees about how their data is used.
Effective workforce analytics draws from multiple data sources, each offering a different angle on your current workforce.
HRIS (Human Resources Information System): Your core employee database. It holds the basics: headcount, tenure, role history, and employment status.
ATS (Applicant Tracking System): Tracks the full recruitment funnel, from application to hire. Rich source of time-to-hire, source-of-hire, and funnel conversion data.
Performance management systems: Links individual performance data to broader workforce trends and improve workforce efficiency.
Engagement and survey tools: Captures employee sentiment and engagement levels, which connect strongly to retention and productivity outcomes.
LMS (Learning Management System): Tracks skills development and training completion across your workforce.
Attendance, time, and payroll data: Feeds into absenteeism analysis, cost modeling, and productivity metrics.
External labor market data: This is where platforms like Horsefly come in. Internal data tells you what's happening inside your organization. External data, drawn from over a trillion data points across 170,000 towns and cities in 65 countries, tells you what's happening in the market. You need both to get the full picture.
When these sources are integrated, you move from fragmented reports to genuine workforce intelligence.
If you’re interested in hearing more about workforce trends in your industry, get in touch today.

Workforce data analytics platforms vary significantly in what they cover. Here's how Horsefly's capabilities map to common analytics challenges across industries.
Talent location strategy: Horsefly's Supply and Demand Insights and Global Heat Maps let organizations visualize where talent pools are concentrated geographically, down to city level. This is particularly valuable for organizations making location decisions for new offices, remote hiring strategies, or expansion planning.
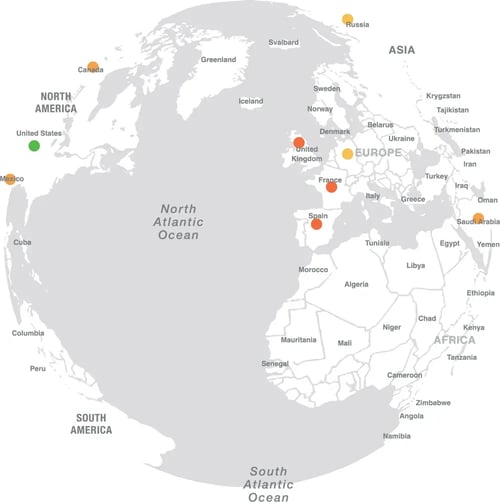
Image shows a Global Heat Map from the Horsefly platform
Skills intelligence: The Skills Insights module lets HR teams benchmark their workforce's current skills against market standards, identify gaps, and track emerging skills before they become mainstream requirements. Signal Skills specifically surfaces skills that are growing in demand before they're widely recognized, giving organizations an early-mover advantage in talent development.
Difficulty of Hire planning: Before committing recruiting resources to a role, Horsefly's Difficulty of Hire Insights lets teams understand how hard it will actually be to find the right talent in a given location, factoring in diversity considerations and market competition.
Compensation benchmarking: Compensation Insights and Cost of Living data give HR and compensation teams the market context to build packages that attract and retain talent without over- or under-shooting.
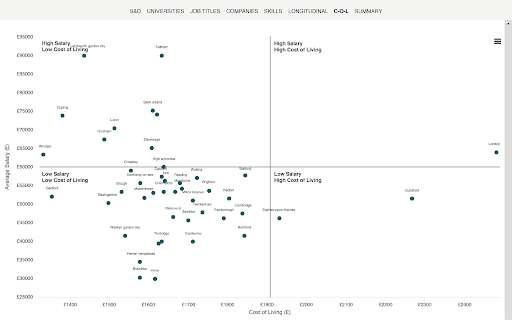
Image shows cost of living data from the Horsefly platform
AI impact planning: Horsefly's AI Impact Analysis helps organizations understand how automation trends are likely to reshape specific roles over time, giving workforce planners the data they need to prepare rather than react.
DEI strategy: DEI Insights aggregates comprehensive data to support inclusive hiring, benchmark diversity progress, and identify talent pools that align with internal representation goals.
The platform is designed to require no mastery, a user-friendly interface built for the people actually making workforce decisions, with data refreshed and validated daily.
For more on how workforce data analytics has evolved, take a look at our evolution of workforce data analytics.
