What Is Data Analytics Software?
Data analytics software is essentially a set of tools that helps you collect, process, analyze, and visualize data so you can make smarter decisions. Instead of drowning in spreadsheets or relying on gut instinct, these platforms turn raw information into actionable insights.
Think of it as the brain that makes sense of your business's nervous system. It takes data from various sources - customer databases, financial systems, operational logs, market intelligence - and transforms it into something you can actually use.
Key Features and Functionalities of Data Analytics Software
Most of the best data analytics platforms share a few core capabilities:
Data collection and integration: The ability to pull information from multiple sources and bring it together in one place. This might include databases, APIs, cloud storage, or even web scraping.
Data processing and cleaning: Raw data is messy. Good analytics software helps you standardize formats, remove duplicates, and fix errors so your analysis is based on accurate information.
Analysis tools: This is where the magic happens. Statistical analysis, predictive modeling, pattern recognition, and various algorithms that uncover trends and relationships in your data.
Data visualization: Numbers on a spreadsheet don't tell a story. Charts, graphs, dashboards, and interactive reports make insights accessible to people who don't have a PhD in statistics.
Reporting and sharing: The ability to create automated reports, schedule updates, and share findings with stakeholders across your organization.
Types of Data Analytics Software
The business data analytics software landscape includes several distinct categories:
Business intelligence (BI) software tools focus on historical data analysis and reporting. They're brilliant for understanding what happened and why.
Statistical analysis software is designed for serious number crunching. If you're running complex statistical models or academic research, these are the tools you should be looking out for.
Data visualization tools specialize in turning data into compelling visual stories. While many BI platforms include visualization, dedicated tools like this could be what you need.
Big data analytics software handles massive datasets that traditional tools would struggle with. These platforms process billions of records without breaking a sweat.
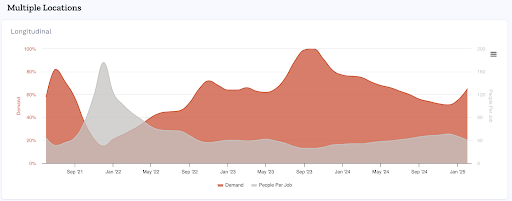
Predictive analytics and machine learning platforms don't just tell you what happened; they help forecast what's coming. These tools use algorithms to identify patterns and make predictions based on historical data. An example of this is the Horsefly Longitudinal value the platform offers, which can help businesses accurately forecast supply and demand trends.
The lines between these categories are increasingly blurred. Many modern platforms combine multiple capabilities, giving you BI, visualization, and even machine learning in a single package.
Benefits of Using Data Analytics Tool
Let's be honest: you wouldn't be reading this if you weren't already convinced that data matters. But there's a difference between knowing data is important and actually using it to drive tangible business outcomes.
Improved Decision-Making
The most obvious benefit is better decisions. Instead of relying on hunches or the loudest voice in the meeting, you base choices on actual evidence. You can see which products are performing, which marketing channels deliver ROI, and which operational processes need fixing.
This doesn't mean data replaces human judgment - it enhances the process of making data-driven decisions. You still need experience and intuition, but now they're backed by facts rather than assumptions. You can gain insights like this from the Horsefly platform, so get in touch if you’d like more expert guidance.

Increased Operational Efficiency
The best data analytics software helps you spot inefficiencies you didn't know existed. Maybe your supply chain has bottlenecks that cost you thousands per month. Perhaps certain processes take twice as long as they should. Or you're staffing your contact center based on outdated patterns rather than actual demand.
Software for data analytics identifies these issues and quantifies their impact, making it easy to prioritize improvements for scalable and measured results to meet key performance indicators.
Enhanced Customer Service
Understanding your customers isn't guesswork anymore. Through processing data, analytics platforms reveal who your best customers are, what they want, when they're likely to buy, and why they might leave. This insight lets you personalize experiences, predict needs, and solve problems before customers even notice them.
For workforce planning specifically, tools like Horsefly Analytics help organizations understand talent markets with the same rigor they apply to customer markets - analyzing supply and demand, identifying skills gaps, and benchmarking compensation to attract and retain the right people. Contact us so that we can discuss your needs.
Competitive Advantage
Here's the uncomfortable truth: other companies within your industry are using data. Companies that effectively leverage analytics can spot market trends earlier, respond to changes faster, and outmaneuver rivals who are still making decisions based on quarterly reports and executive intuition.
This advantage compounds over time. Better data leads to better decisions. Better decisions lead to better outcomes. Better outcomes generate more data. It's a virtuous cycle.
Risk Mitigation
Data analytics helps you see problems coming. Financial anomalies that might indicate fraud. Customer churn patterns that signal dissatisfaction. Supply chain risks based on geopolitical factors. Market shifts that could impact demand.
By identifying these risks early, you can take action before they become expensive disasters.
Popular Data Analytics Software Options: A Comparison
The analytics software market is crowded, which is both good news and bad news. Good because you've got options. Bad because choosing between them requires actual work.
Here's a realistic look at some of the most popular tools, from data analytics software companies, organized by use case rather than arbitrary lists of what they can do.
For Business Users Who Need Quick Insights
Microsoft Power BI has become the go-to for many organizations, particularly those already in the Microsoft ecosystem. It's reasonably priced, integrates seamlessly with Excel and other Microsoft tools, and offers enough power for most business analytics needs. The learning curve is manageable for non-technical users, though getting really advanced requires some investment in training.
Tableau is beloved by data visualization enthusiasts for good reason - it makes creating compelling, interactive dashboards relatively straightforward. It's more expensive than Power BI but offers superior capabilities when it comes to visualizing data.
Looker (now part of Google Cloud) shines when you need governed, consistent metrics across your organization. It's built for teams where different people need to access the same data without creating conflicting versions of the truth. The trade-off is that setup requires more technical expertise than plug-and-play alternatives.
For Technical Teams Doing Serious Analysis
Python isn't technically a software product - it's a programming language. But with libraries like pandas, NumPy, and scikit-learn, it's become the Swiss Army knife of data analysis. It's free, incredibly flexible, and has a massive community. The catch? You need coding skills or the willingness to learn them.
R is similar to Python but more focused on statistical techniques and advanced analytics. If you're running complex statistical models or doing academic research, R has capabilities that general-purpose tools can't match. Like Python, it requires programming knowledge but offers flexibility.
SQL is the language of databases. Any advanced data work eventually involves SQL, whether you're using it directly or through another tool. It's not flashy, but it's fundamental - knowing SQL is like knowing how to read for data professionals.
For Big Data and Cloud Analytics
Apache Spark handles datasets that would make conventional tools weep. If you're processing billions of data sets from multiple data sources or need real-time analytics on streaming data, Spark is built for that scale. It requires significant technical infrastructure and expertise, so it's overkill for most small to mid-sized organizations.
dbt (data build tool) has revolutionized how analytics teams transform data. It's not a complete analytics platform, but if you're building data pipelines and need to maintain data quality at scale.
For Specific Use Cases
KNIME Analytics Platform is brilliant for building visual data workflows without writing code. It's particularly popular in life sciences and research environments where analysts need sophisticated capabilities but may not be programmers.
RapidMiner focuses on machine learning and predictive analytics, offering a visual interface for building models. It's positioned between drag-and-drop simplicity and code-based flexibility.
Jupyter Notebook has become the standard environment for data scientists to explore data, build models, and document their work. It's not a complete analytics platform, but if you're doing exploratory analysis or building machine learning models, Jupyter is likely in your toolkit.
Cost Considerations
Pricing varies wildly across data analytics software providers, so don't forget to factor in implementation costs, training, and ongoing maintenance. A "cheap" tool that requires months of consulting work to set up isn't actually cheap.
How to Choose the Right Data Analytics Software for Your Needs
Right, you've seen the options of some top data analytics software. Now comes the hard part: actually choosing the best software for data analytics to meet your needs.
Define Your Business Requirements and Goals
Start with the basics: what problems are you trying to solve? Be specific. "Better insights" isn't a goal, whereas, "Reduce time-to-hire by identifying talent pools in emerging markets" is a goal. "Identify which marketing channels drive highest-value customers" is another example of a goal you want to meet.
Also consider who'll be using the tool and how it will assist in data exploration. Are you building something for data scientists who live in SQL? Or for marketing managers who think Python is a snake? The right answer depends entirely on your team.
Assess Your Data Infrastructure and Capabilities
Where does your data live today? In a modern cloud data warehouse? Scattered across seventeen different systems that don't talk to each other? Still in Excel spreadsheets on various people's desktops?
Your analytics tool needs to work with your current infrastructure. A few can handle anything but require significant setup work.
Be honest about your technical capabilities, too. A powerful platform that requires a team of data engineers is useless if you don't have data engineers.
Evaluate the Software's Features and Functionalities
Match features to actual needs rather than impressive-sounding capabilities. Do you need real-time dashboards, or are daily updates fine? Is advanced machine learning essential or just nice-to-have? Will you actually use that natural language query interface or is it just a demo feature?
Pay special attention to integration capabilities. Analytics tools don't exist in isolation - they need to pull data from your existing systems and push insights to where decisions get made.
Consider the Total Cost of Ownership
License fees are just the start. Factor in implementation costs, training, ongoing support, infrastructure requirements, and the opportunity cost of choosing wrong.
Sometimes the "expensive" enterprise solution is actually cheaper long-term because it reduces technical debt and support burden. Other times, the free open-source option is genuinely the smartest choice because your team has the skills to use it effectively.
Prioritize Data Security and Governance
This isn't glamorous, but it's critical. How does the platform handle sensitive data? Can you control who sees what? Does it meet compliance requirements for your industry and geography?
For organizations handling employee or talent data, this is especially important. Workforce analytics platforms need robust security and clear governance frameworks to protect individual privacy while still enabling strategic insights.
From Data to Actionable Insights: Implementing and Using Data Analytics Solutions Effectively
Buying the tool is just the beginning. Like a gym membership, the value comes from actually using the software for data analytics properly.
Data Collection and Preparation
Rubbish in, rubbish out. This cliché exists because it's painfully true. Before you can analyze anything, you need quality data. This means establishing clear processes for data collection, standardizing formats, cleaning errors, and maintaining consistency.
This unglamorous work consumes about 80% of most analytics projects. Budget time and resources accordingly.
Data Modeling and Analysis
This is where you translate business questions into analytical approaches. What metrics actually matter? What relationships should you explore? How will you know if you've found something meaningful versus random noise?
Good analytics platforms make this easier, but they don't do the thinking for you. You still need domain expertise and analytical judgment.
Data Visualization and Reporting
Creating visualizations is easy. Creating visualizations that actually communicate insight is harder. Think carefully about your audience. What do they need to know? What decisions will this inform? How much context do they need?
Automated dashboards are brilliant for routine monitoring. Custom reports work better for specific strategic questions. Choose the right format for the purpose.
Training and Support
Don't underestimate the importance of proper training. Even user-friendly tools have learning curves. Invest in getting your team up to speed, whether through vendor training, online courses, or internal knowledge sharing.
Also establish clear support structures. When someone hits a problem at 4pm before a big presentation, who do they call?
At Horsefly Analytics, we thrive on being here for our customers to turn to - collecting data is fantastic, but if you’re not quite sure how to go about interpreting data, it’s not going to be put to much use. This is where our team of experts comes in. Companies will have their own Customer Success Representative who will know your business from the inside, out and who will offer you guidance and training for your teams on analyzing data. We tailor everything for your business, so get in touch for a custom consultation for your specific needs.

Data Governance and Security Best Practices
Establish clear policies about data access, usage, and sharing. Who can see what? How should sensitive information be handled? What approvals are needed before sharing insights externally?
These guardrails prevent problems before they happen and ensure your analytics program builds trust rather than creating risk.
Future Trends in Data Analytics Software
The analytics landscape keeps evolving. Here's what's coming down the pipe.
AI and Machne Learning Integration
Every analytics vendor is shoving "AI" into their marketing materials, which makes it hard to separate substance from hype. But genuinely useful AI capabilities are emerging: automated pattern detection, natural language interfaces, and predictive models that don't require data science PhDs.
The key is understanding what you need. AI that automates routine analysis frees up time for strategic thinking. AI that generates marketing buzzwords wastes everyone's time.
Cloud-Based Solutions
The shift to cloud continues. Cloud platforms offer scalability, accessibility, and lower upfront costs compared to on-premise systems. They also enable new capabilities like real-time collaboration and automatic updates.
The trade-offs are ongoing subscription costs and potential concerns about data sovereignty for organizations in regulated industries.
Self-Service Analytics
Organizations are pushing analytics capabilities out to business users rather than concentrating them in centralized data teams. Modern platforms make this possible through intuitive interfaces, governed data models, and guided analytics workflows.
This democratization is powerful but requires careful implementation. Self-service without governance creates chaos. Self-service with proper guardrails multiplies analytical capacity.
Real-Time Data Analysis
Batch processing that updates reports overnight is giving way to real-time analytics that reflects current conditions. This matters for use cases like fraud detection, dynamic pricing, or operational monitoring where decisions need to happen now, not tomorrow.
Augmented Analytics
This buzzword refers to systems that proactively surface insights rather than waiting for users to ask questions. Think of it as having an analyst constantly monitoring your data and flagging interesting patterns.
It's promising but still early. The technology is improving, but human judgment remains essential for separating genuine insights from statistical noise.
For Workforce and Talent Intelligence
While tools like Power BI, Tableau, and Python excel at analyzing your internal data, Horsefly Analytics bridges the gap between internal metrics and external market intelligence. It's designed to work alongside your existing analytics stack - feeding labor market data into your BI dashboards, enriching your workforce models with real-time talent supply information, and providing the external context your internal data can't capture.
The platform integrates seamlessly with business intelligence tools, allowing you to combine Horsefly's market insights on 815,000 job titles across 170,000 locations with your own hiring data, turnover metrics, and workforce plans. Whether you're visualizing talent availability in Tableau, building predictive models in Python, or creating executive dashboards in Power BI, Horsefly provides the external labor market layer that turns internal workforce analytics into strategic talent intelligence that's actionable.
Making Data Work for Your Business
Choosing data analytics software isn't really about picking the tool with the most features or the cleverest marketing. It's about finding the solution that fits your actual needs, integrates with your existing systems, and empowers your team to make better decisions.
Start with clear goals. Understand your constraints. Evaluate options honestly rather than falling for sales pitches. And remember that the tool itself is just infrastructure - the real value comes from using it consistently to inform how you run your business.
Whether you're analyzing customer behavior, optimizing operations, or planning your workforce strategy, the right data and analytics software transforms data from an abstract concept into a genuine competitive advantage.
Ready to see how data analytics can transform your talent strategy? Horsefly Analytics provides labor market intelligence and workforce insights that help you make smarter hiring, location, and compensation decisions. Schedule a strategic consultation to see how global workforce data can inform your talent planning.
Sources - Horsefly Analytics, The Knowledge Academy, Forbes, Microsoft Power BI, Tableau, Looker, Apache Spark, dbt, KNIME Analytics Platform, RapidMiner, Jupyter Notebook
